Since its creation in 2009, Uber Technologies Inc. has grown into the largest and most recognizable ride-hailing app in the world.
The company was founded in San Fransisco by Garrett Camp and Travis Kalanick to streamline the process of booking a cab in the city. It quickly expanded to become one of the most popular gig economy platforms, offering rides, food, and grocery delivery.
Uber has experienced a lot of changes over the years. To give you an accurate view of where the company stands now, we’ve compiled stats about its financial performance, drivers, riders, and how it compares to the competition.
Read on for an overview of the most up-to-date Uber statistics and data insights.
Key Uber Stats
- Uber had $31.8 billion in revenue in 2022.
- Uber has 72% of the ride-hailing industry market share.
- 64 billion trips were taken with Uber in 2022.
- Uber had 131 million monthly active users in 2022
- There were 5.4 million Uber drivers in 2022.
- Uber offers ridesharing services in over 10,000 cities across 72 countries.
Fast Facts
- Founded: 2009
- Founders: Garrett Camp, Travis Kalanick
- Current CEO: Dara Khosrowshahi
- Headquarters: San Fransisco, CA
- IPO: May 10, 2019
- NYSE: UBER
Financial Performance Stats
Here are some key stats on Uber’s financial performance, including its annual revenue, profits and losses, and operating costs.
Revenue by Year
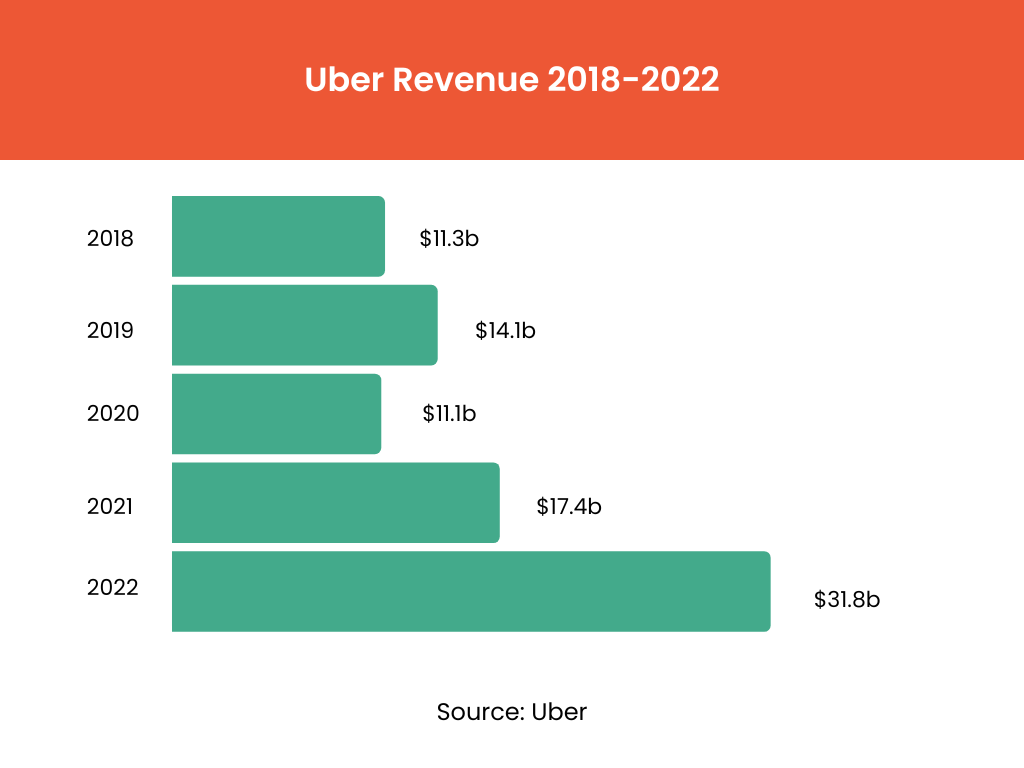
According to Uber’s annual financial reports, here’s an overview of the company’s revenue from 2018 to 2022.
In 2022, Uber’s revenue nearly doubled from the last year, reaching $31.8 billion. That’s a massive increase from the company’s 2020 revenue, which dipped to $11.1 billion as a result of the COVID-19 pandemic.
Revenue by Region
In the last three months of 2022, Uber’s revenue totaled $8.6 billion. When we break that revenue down by geographical region, more than half of Uber’s earnings came from the US and Canada.
Here’s an overview of Uber’s Q4 revenue by region (in millions):
- US and Canada: $4,976
- Europe, Middle East, and Africa: $2,092
- Asia Pacific: $992
- Latin America: $547
Between Q4 of 2021 and Q4 of 2022, Europe, the Middle East, and Africa (EMEA) saw the most substantial growth in revenue, increasing by 110%. Revenue in the US and Canada increased by 38% over the course of a year.
Revenue by Segment
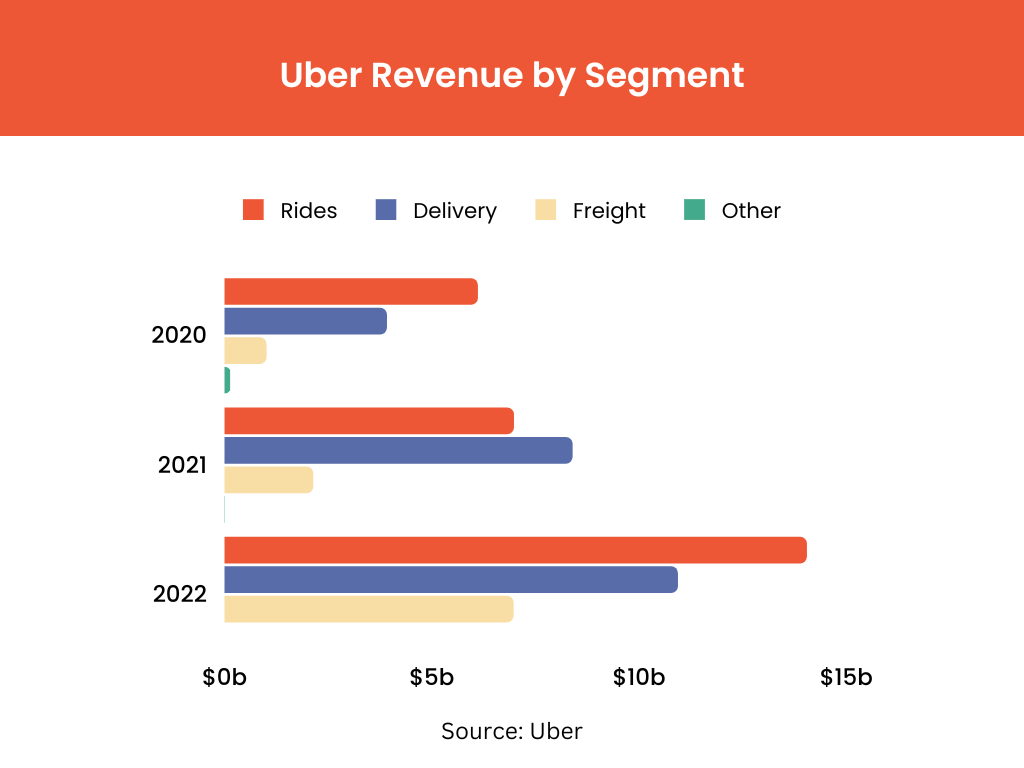
Uber breaks its revenue down into three segments—mobility, delivery, and freight. In 2022, Uber’s most significant source of revenue was its ridesharing platform. The company made $14 million in revenue from its mobility services.
Uber made an additional $10.9 billion in revenue through its on-demand delivery platform, Uber Eats, and $6.95 billion from Uber freight services.
The chart below shows Uber’s revenue by segment from 2020-2022. It’s important to note that Uber reported an “other” source of revenue in previous years but didn’t use this metric in 2022.
Profits and Losses
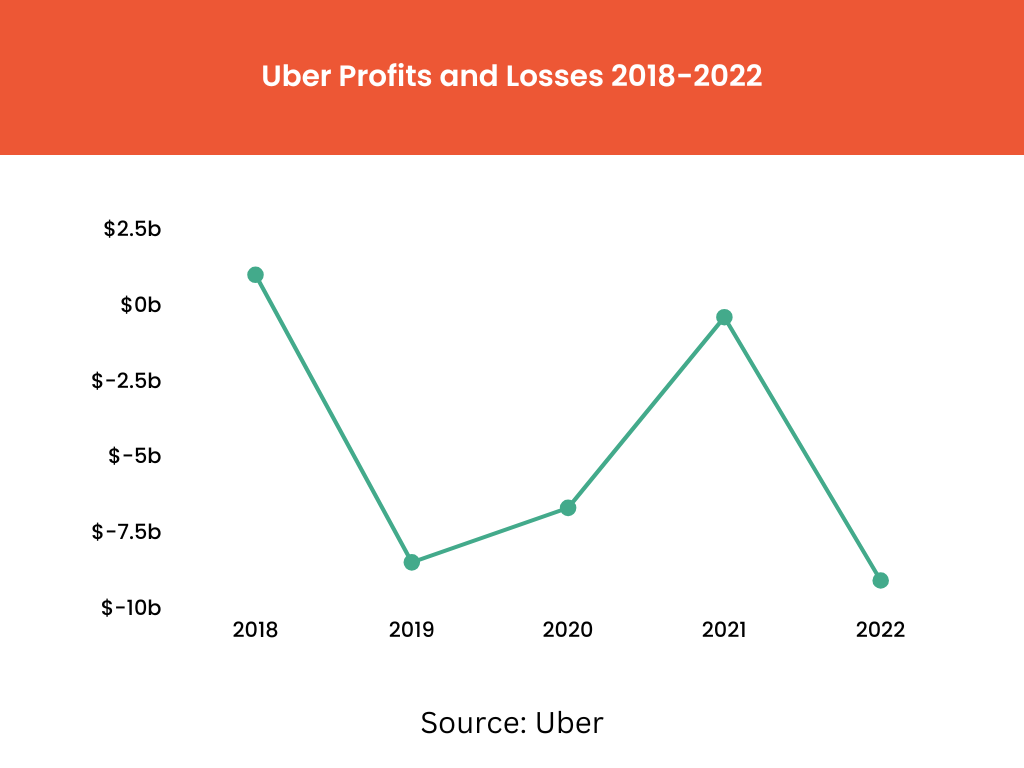
Historically, Uber has only had one profitable year. In 2018, the company reported a net profit of $997 million. Every other year,
Here’s an overview of Uber’s annual profits and losses from 2018-2022.
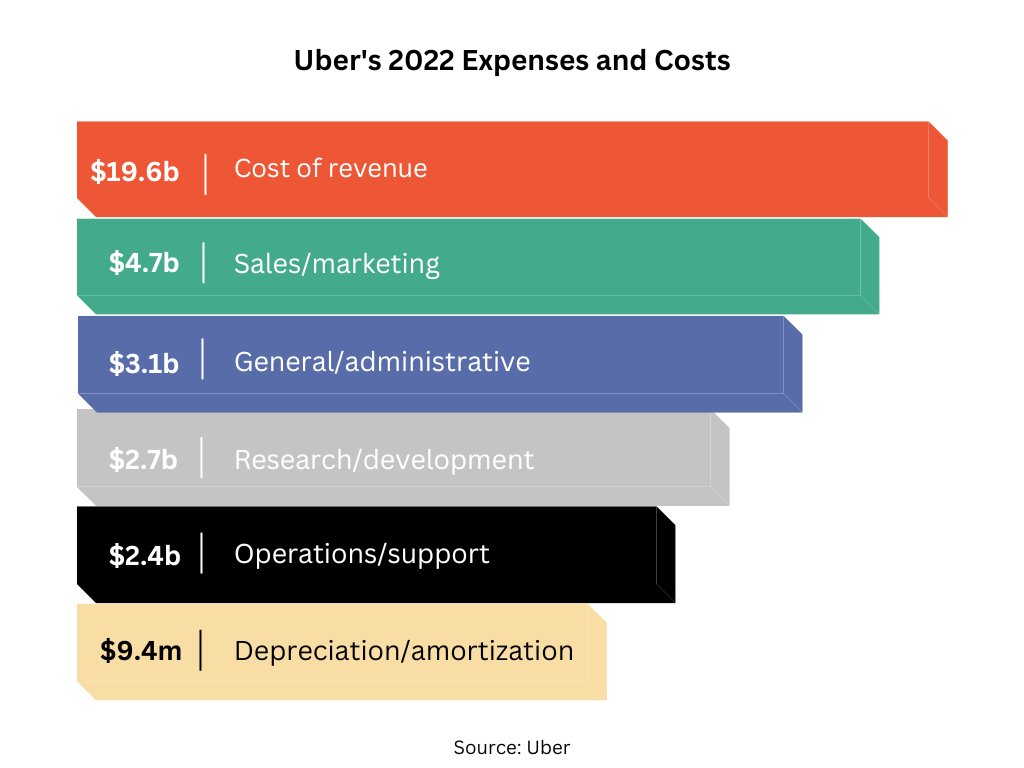
Costs and Expenses
According to Uber’s Q4 investor report, the company’s 2022 costs and expenses totaled over $33 billion.
Here’s a breakdown of Uber’s costs and expenses, including revenue, operations, marketing, and other categories.
Uber Business Stats
Funding
According to Crunchbase, Uber has gone through 32 rounds of fundraising since its inception, raising $25.2 billion. The ridesharing company has more than 100 investors, including PayPal and Toyota Motor Corp.
Uber raised $1.6 million in seed money in September 2010. Series A from February 2011 raised $14.1 million. A Series B funding round raised $43.8 million in December 2011. In August 2013, a Series C round of funding raised a total of $364.2 million.
The next three rounds of funding raised a total of $5.3 billion between June 2014 and May 2015.
From August 2015 to January 2020, a grand total of $18.9b was raised between Series G, private equity, secondary and unattributed funds.
Uber raised the most funds in 2019, with a total of $20.9 billion. The most recent round of fundraising was a post-IPO debt round announced on September 14, 2020, that amounted to $500 million.
Uber Market Share
Uber dominates the ridesharing market. Bloomberg’s Second Measure reports that Uber held 72% of the US market share for ride-hailing platforms in 2022.
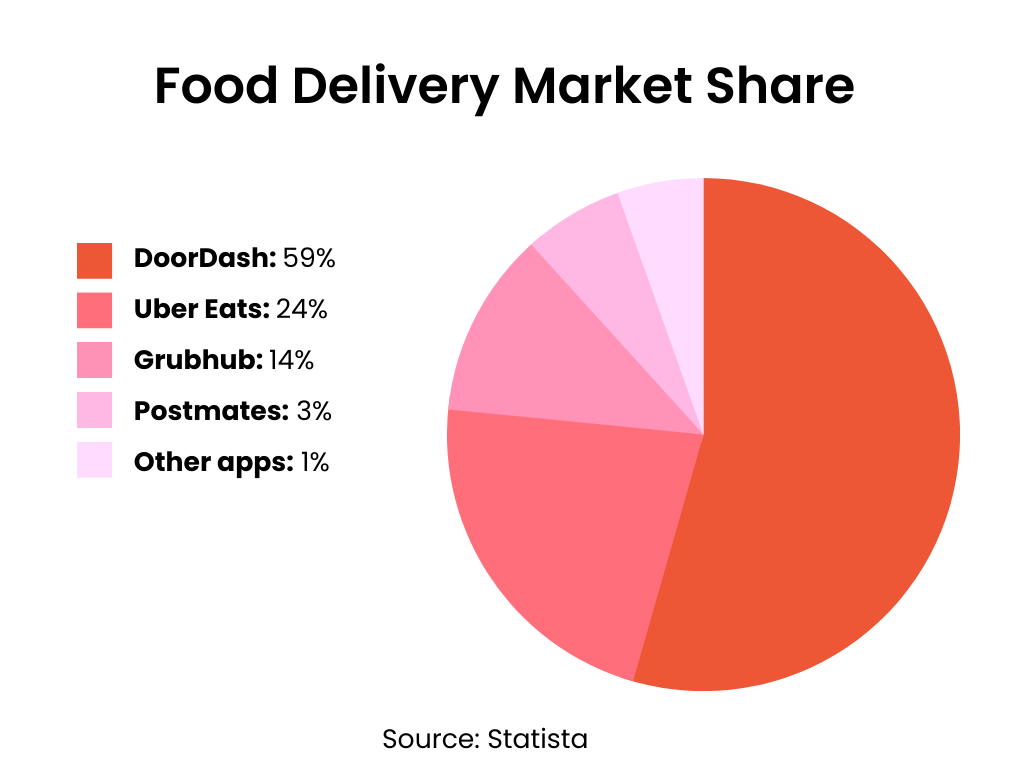
Uber Eats also leads the food delivery industry, with 24% of the industry’s market share. Here’s a breakdown of the food delivery market share, featuring data from Statista.
Uber Acquisitions
At the time of writing, Uber has acquired 16 companies, expanding its reach across the US and globally.
Here’s a list of businesses Uber has acquired since 2015:
- deCarta (2015)
- Geometric Intelligence (2016)
- Otto (2016)
- Swipe Labs (2017)
- orderTalk (2018)
- JUMP Bikes (2018)
- Mighty AI (2019)
- Cornershop (2019)
- Autocab (2020)
- Routematch (2020)
- Careem (2020)
- Postmates (2020)
- Drizly (2021)
- Transplace (2021)
- HK Taxi (2021)
- Car Next Door (2022)
Uber Bookings and Trips
Bookings
Uber reported that its gross bookings increased by 19% year-over-year in 2022, totaling $115 billion.
Here’s a summary of Uber’s gross annual bookings for the last five years.
| Gross Bookings | Year |
| $50 billion | 2018 |
| $65 billion | 2019 |
| $57 billion | 2020 |
| $90 billion | 2021 |
| $115 billion | 2022 |
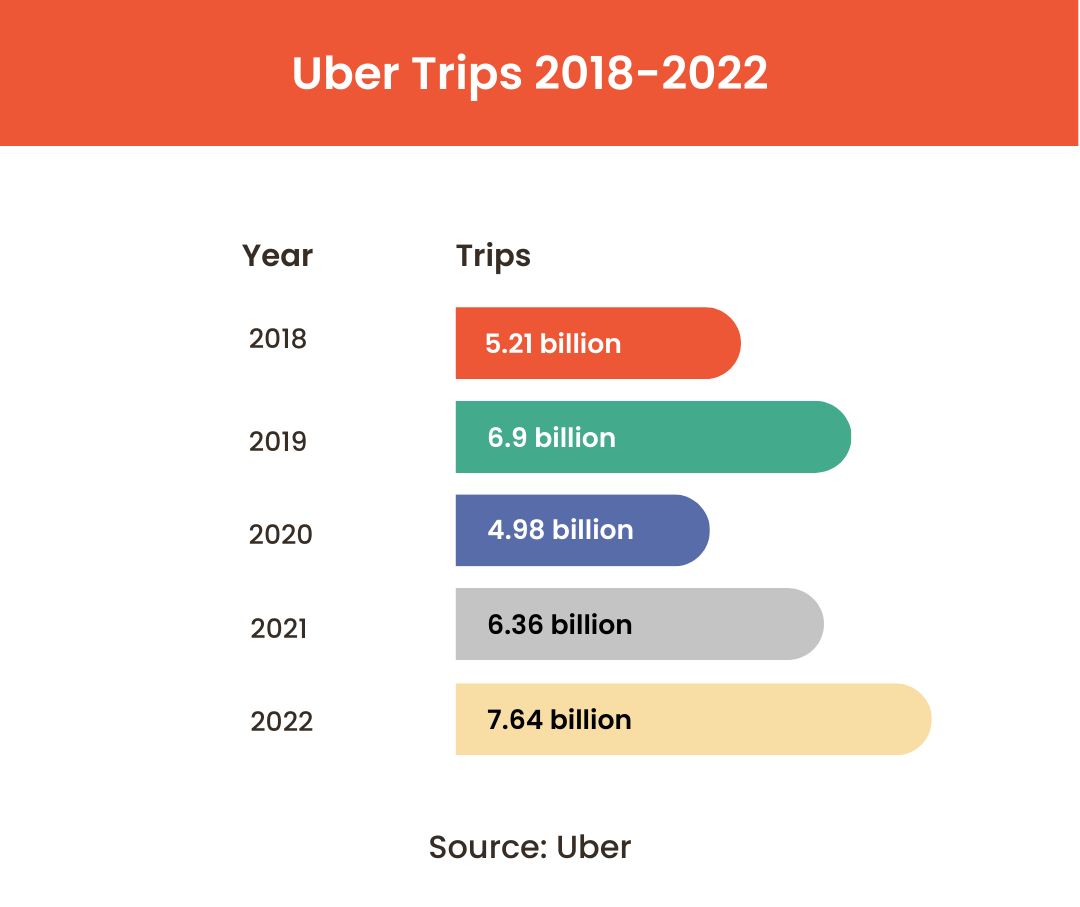
Number of Trips
Curious about how many trips are booked through the Uber app? In its annual financial report, Uber reported that 7.64 billion trips were taken with Uber in 2022.
And in Q4 of 2022, Uber recorded 2.1 billion trips, more than any other quarter in its history. That averages out to 23 million trips per day.
As you can see in the chart below, more Uber rides were booked in 2022 than in previous years. You can also see how significantly rides slowed down in 2020 amidst the coronavirus pandemic.
Uber Trips by Location
Uber recently disclosed that 24% of its rides are booked in these five cities:
- New York City
- Los Angeles
- San Francisco
- London
- São Paulo
Uber Users
Wondering who uses Uber? Read on for some stats about the people who book rides with Uber.
Number of Uber Users
Uber’s annual financial report revealed that the company had 131 million monthly active users in 2022. That’s an 11% increase from 2021.
User Demographics
Global Web Index conducted a survey of Uber users in 2017 that shed some light on the people who use Uber’s services. Here were some key findings about their demographics:
- Gender: 48% of Uber users are women, and 52% are men.
- Age: 65% of Uber users are 16-34 years old.
- Income: 44% of Uber’s users are in the mid 50% of earners.
- Location: 48% of Uber users live in suburban areas, 46% live in urban areas, and 6% live in rural areas.
Uber Drivers
Here are some key stats about Uber drivers, from how many Uber drivers there are to their earnings and work preferences.
Number of Uber Drivers
Uber reported having 5.4 million drivers in 2022, which is more than double the number of drivers it had in 2017.
Uber didn’t share how many active drivers were in the US in 2022. However, in 2019 the company claimed to have 1 million US drivers, a number that’s probably increased significantly as Uber’s overall driver count has grown.
Uber Drivers by Gender
In 2020, a Stanford study revealed that around 27% of Uber drivers in the US between 2015 and 2017 were women.
The survey showed that male drivers earned an average of $21.28 per hour driving for Uber, while female drivers made an average of $20.04.
The study also found that men drive around 5 more hours a week for Uber than women.
Uber Driver Attrition Rate
Stanford’s study suggested that women are more likely to quit driving for Uber within six months than men are. The six-month attrition rate for female Uber drivers is 75%, compared to 65% for men.
While women had a higher attrition rate than men on average, the number of people who quit driving for Uber is high for both genders.
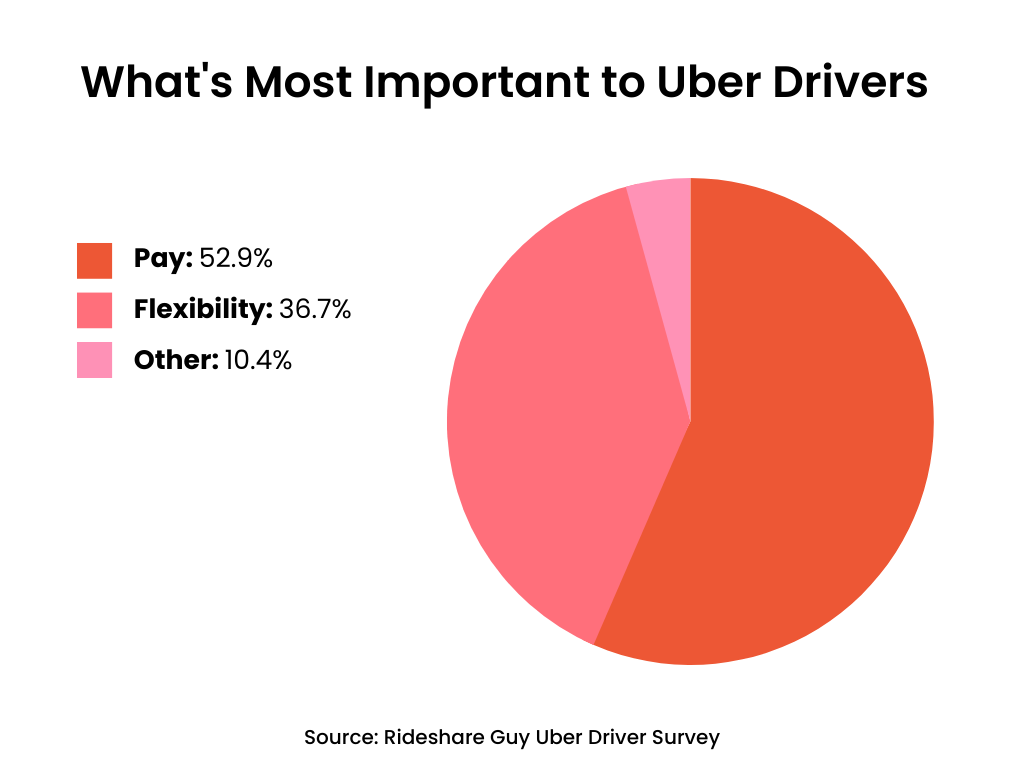
Uber Driver Preferences
In our most recent Rideshare Guy driver survey, we polled nearly 1,000 Uber and Lyft drivers to gauge their satisfaction and preferences.
Here were some key findings:
- 71% of rideshare drivers wanted to continue to work as independent contractors rather than Uber employees.
- 8% of drivers were satisfied with their experience driving for the Uber platform.
- 5% of Uber drivers said they also work for other companies.
- 55% of drivers said the biggest way Uber could improve their experience would be higher pay.
- Uber drivers earned an average of $2.24 more per hour than Lyft drivers.
Looking for more Lyft stats? Find our Lyft statistics here.
Fun Uber Facts
- In 2015 in Manhattan, Ela Melanie was the first baby born in an Uber.
- Uber used to offer a service called UberKITTENS that let people buy 15 minutes of cuddle time with a kitten from a shelter.
- According to Uber, the top 5 most forgotten items left in Uber rides in 2022 were phones/cameras, wallets, keys, bags, and headphones.
- The Lost and Found Index also revealed that riders are most forgetful on Saturdays and Sundays.
The Future of Uber
Since 2009, Uber has created a unique rideshare app that millions of Android and iOS users enjoy worldwide. However, despite Uber having the largest market share in the ride-hailing services industry, the company has some work to do to become profitable.
With approximately 5.4 million drivers globally, it would be wise for Uber to listen to drivers’ concerns moving forward, particularly surrounding pay and flexibility—the two most important things to drivers.
Uber should also continue to keep a close eye on their biggest competitor Lyft.