With Uber’s recent upfront pricing changes, you may be wondering how to calculate your new pay vs. Uber’s cut. Luckily, today RSG contributor Will Preston provides his spreadsheet analysis and a step-by-step walk through for calculating your new driver pay. Questions? Leave them below in the comments!
There was a time when we knew exactly how much Uber made from each ride. It was 20% of however much the rider paid. Then 20% turned into 25%, but still that was easy to understand. Things got more complicated when Uber introduced the booking fee – currently $1.95 in my market – and did not give us a cut of that fee. That effectively increased Uber’s share of each ride by a significant amount, and the smaller the fare, the greater their percentage.
Then UberPOOL was introduced, and it became nearly impossible to figure out how much they were making. The complete disconnect between what customers were paying and what drivers were paid left many drivers feeling that they were getting ripped off. Knowing that Uber was getting paid for multiple riders – while the driver only got paid for a single trip – added to that frustration and fear.
Introducing Upfront Pricing
Then came Upfront Pricing. Uber would calculate and display to the passenger the price of the ride they were about to take. As long as they did not change the destination and the driver didn’t do anything crazy with the route, their fare would remain the same as what they were quoted. The driver, on the other hand, would be paid based on their mileage and time – just like always. Drivers who took a route that was shorter or faster than the one Uber had used to calculate the price would get shortchanged because Uber would pocket the difference. Some drivers argue in this case that the customer was also overcharged. Others feel that as long as the customer is charged what they agreed to pay, then they are not being overcharged, but there’s no disputing that the driver is getting the short end of this stick.
A year after Upfront Pricing was introduced, Uber said they are now experimenting with what I will call value-based pricing. In addition to calculating time and distance, Uber is going to take other things into consideration, such as whether or not the ride is going from or to an affluent neighborhood. If so, they’re going to experiment with charging the customer more. Once again, if Uber takes in more than 25% of what they charged the customer, the driver won’t see a penny of the difference.
Of course, this news went over poorly. Many drivers saw it as yet another example of Uber trying to increase their percentage farther than what they had agreed to. Even my recent article received strong comments, and all I tried to do was tell you how to read the new statements.
As we discussed in that post, drivers can now see what each passenger paid. That means that we can now figure out whether or not we are getting shafted. The purpose of this article is to explain how you can do just that with your own earnings report. I will show you how to figure out the average percentage that Uber is taking of your rides both with and without the booking fee.
A Little Math
Let’s talk about a typical ride using the math from the days before upfront fares. Suppose I give someone a $10 ride from the San Diego airport, which adds a fee of $3.86. To that Uber will add the booking fee of $1.95. That means the passenger pays a total of $15.81. Uber pays the driver $7.50, and pays the airport $3.86 . It then keeps the service fee of $2.50 (25% of $10) and the booking fee of $1.95.

In the old days we knew what the actual fare was, and we knew how much Uber made or lost because it was right there on each ride. But with Upfront Fares and POOL fares it’s not that simple. We have what the rider paid and what we were paid, and we have the fees. If we want to know the other numbers, we have to calculate them. Uber does still show us the service fee, but sometimes there’s a “Service Fee Adjustment” that you need to take into account. My point is it just isn’t as simple as it used to be.
If you have Driver Injury Protection, we added a tab for you in the spreadsheet.
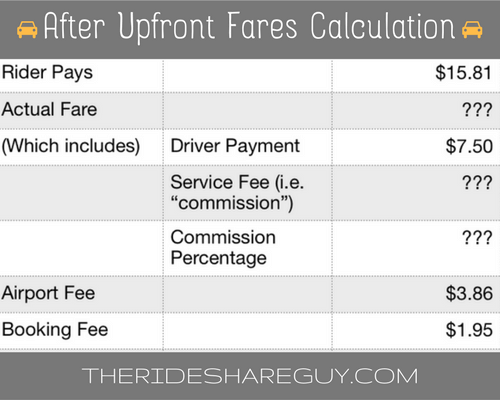
Subtracting the airport fee ($3.81) and the booking fee ($1.95) from what the customer paid ($15.81) gives us $10 as the original fare. From $10 we subtract the driver’s payment ($7.50), which leaves us a service fee of $2.50. Dividing $2.50 by $10 gives us a service fee percentage of 25%. How we calculated the values changes, but the values didn’t – at least in this example.
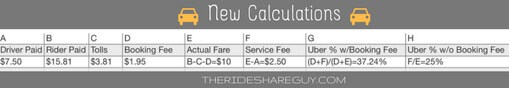
We also want to calculate what percentage Uber kept including the booking fee, right? To do that, we add the service fee ($2.50) to the booking fee ($1.95), which gives us $4.45 to Uber. We then add the calculated actual fare ($10) to the booking fee $1.95, which gives us $11.95. Finally, we divide $4.45 by $11.95, which gives us 37.24%.
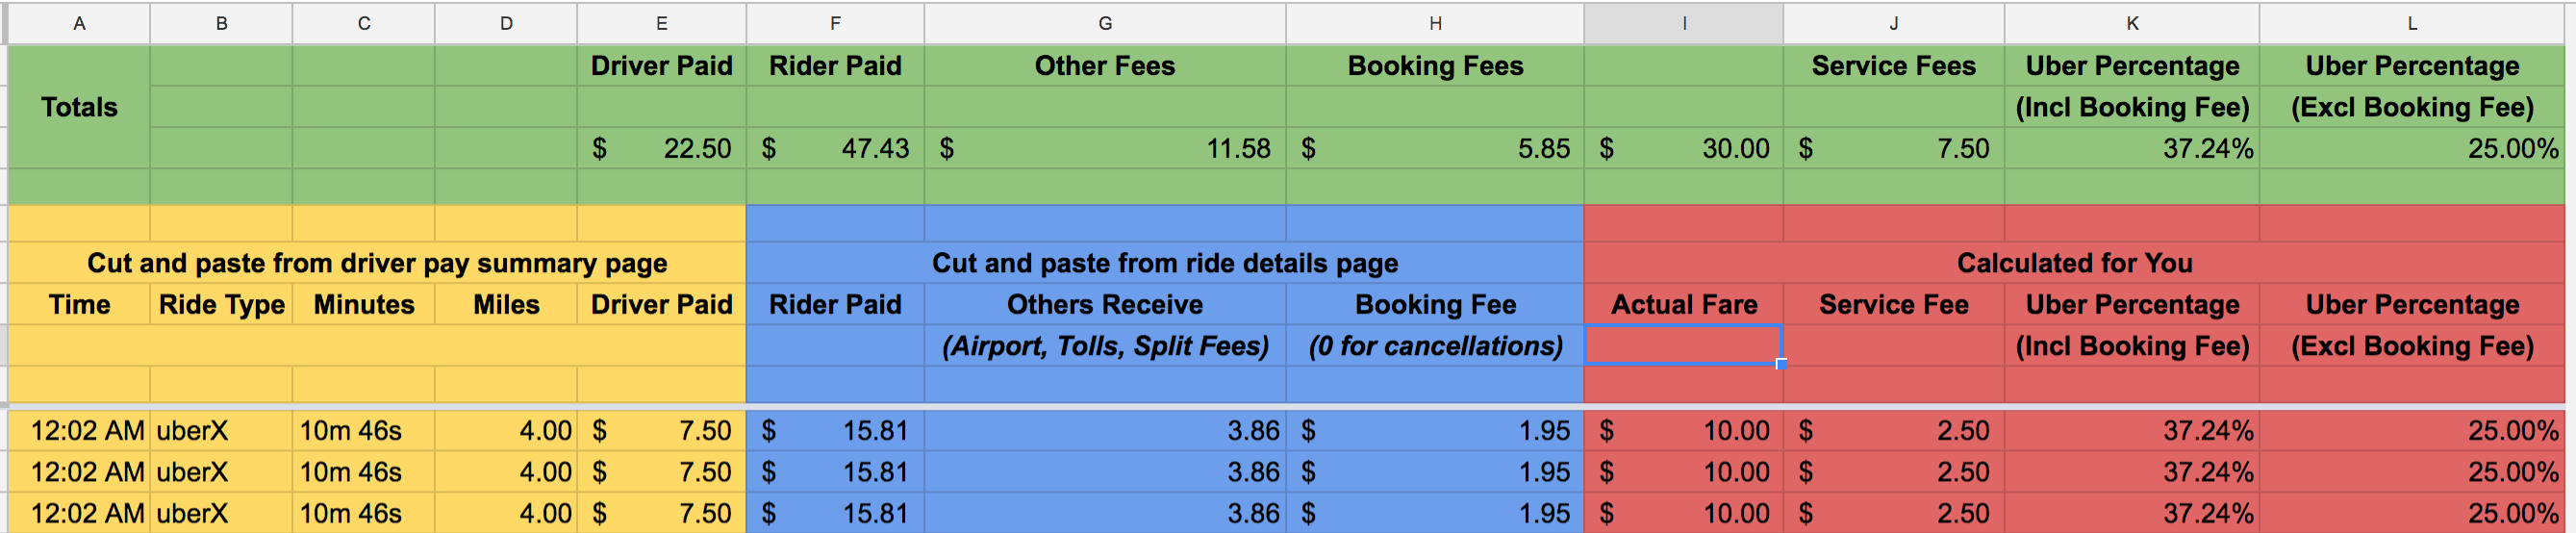
In spreadsheet parlance, that would look something like this:
Calculating Your Ride Data with a Spreadsheet
Take a look at this spreadsheet.
I’m not going to sugar coat it. Putting your data into this spreadsheet is quite a bit of work. But if you do the work, it’ll give you data we haven’t had since Uber went with Upfront Pricing, and the data it calculates might actually surprise you. I know it surprised me.
To use it, you need to copy and paste your payment summary page into the yellow columns, then copy and paste your ride details into the blue columns, and it will calculate the rest of the data for you in the green row and red columns. If you’re not familiar with spreadsheets, there will be a few tricky steps, but I’ll walk you through them. I’ll even make a step-by-step video of the process.
Step 1: Copy my spreadsheet to your Google account
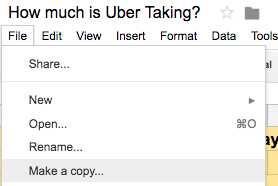
Get yourself a free Google Account (if you don’t have one already) and sign into it. Open the spreadsheet and select File -> Make a Copy.
There is a tab called Example with the sample data from earlier in the article, so you can look at it to see how the calculations in columns I-L (the red columns) are done using numbers that are simple to understand.
Step 2: Copy your Earnings Summary Data into the spreadsheet
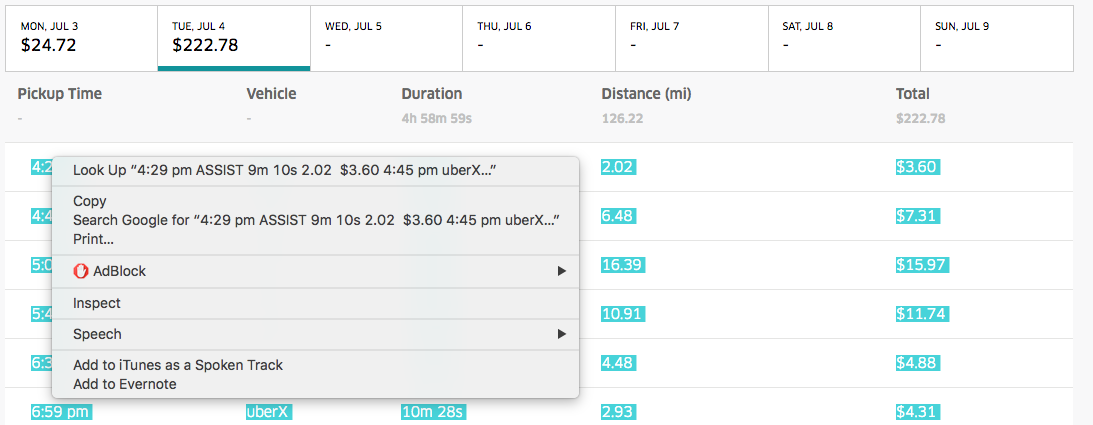
Login to Uber.com and select any pay statement since May 23, 2017 when Uber switched to this new pricing model. Select the appropriate day and then drag and drop your mouse so that you highlight all the rides in all the rows, right click and select Copy.
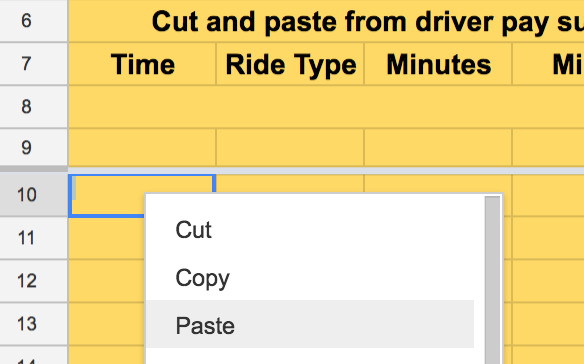
Now go to the Your Rides tab on the spreadsheet, right click on cell A10 and select Paste. If you did it right, your ride data should populate as many rows in the spreadsheet as you have data. Don’t worry if the formulas/calculations don’t add up right, as we’ll fix this at the end!
Note: You can copy and paste multiple days of payments in this single step, but my recommendation is to do the full list of steps on each page, one page at a time.
Step 3: Add the booking fees
Enter your market’s booking fee into cell H10. Then right click on that cell and select Copy.
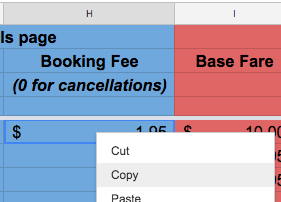
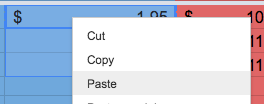
Then highlight the H column for as many rows as you copy and pasted in the last step. If added you 50 rows, then select 50 cells in row H, right click, and select Paste. That will copy the standard booking fee into all the rows.
Step 4: Fix the Booking Fees
If you leave the standard booking fees in place, your data will be a little off, depending on the number of cancellations or POOL rides with more than one rider that you’ve had. This step will fix that.
The first thing to do is look at the list of rides you copy and pasted and see if any had a length of 0 minutes. If so, that was a cancellation and there is no booking fee. Change the value of the booking fee for any of those rows to 0.
You also need to adjust the booking fees for any POOL rides with more than one passenger, as they could be anywhere from 0 to 3 times the normal booking fee, depending on how many passengers you had. To do this, you need to scan the list for POOL rides that have a > sign next to them like this.
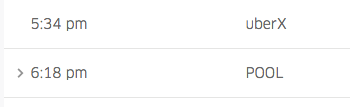
Clicking on the > sign will open up the details of that POOL ride, and show you how many passengers it had. Just add up the number of riders with more than 0 minutes and multiply that times your standard booking fee. In this example, there are two riders, so I multiply $1.95 times 2 to give me $3.90. I would then enter that into the Booking Fee cell for that ride.

Step 5: Check for “Others Receive” Fees
Make sure you’re using a browser like Chrome that supports tabs. Select the tab with the pay statement in it again, and left-click on the first ride. It should open a tab for that ride with all that ride’s details, but don’t stop there. Keep selecting the summary page and clicking on the next ride, which opens a tab for that ride, then going back to the summary page until you’ve opened a tab for every ride from that day.
Depending on your browser, select either the left-most or right-most tab and look at its ride details. What I do – so I don’t miss any other payments – is quickly select each tab and scroll to the bottom to see if there is an “Others Receive” box at the bottom like this. I do not close the tab after I’ve done this. I just quickly click through each tab, scroll to the bottom, look for that box, then move on to the next tab.
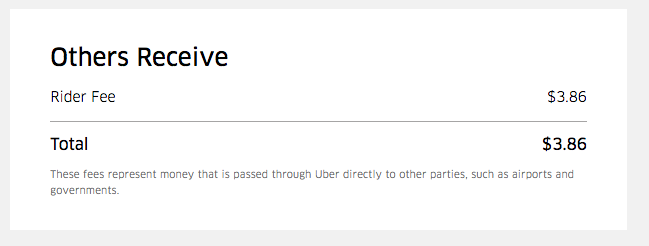
If there is, then put whatever is in that box in column G for that ride. These fees include everything from airport tolls to the $.50 Uber charges for passengers to split their fare with multiple passengers. You probably don’t have a lot of these, but not having these in the spreadsheet will throw off your numbers.
Step 6: Type in the “Rider(s) Pay(s)” value for each ride
Go back to the beginning and select the first tab. Match it’s start time with the appropriate ride and enter the value you see in the Riders Pay box into column F for that ride.
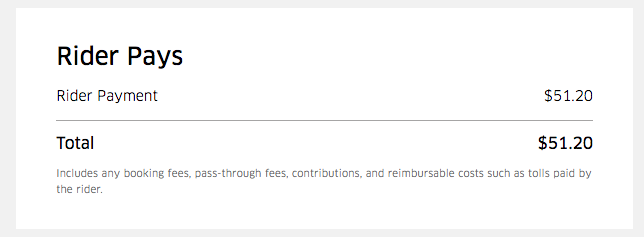
If it’s a POOL ride with more than one passenger, it will say “Riders Pay.” Just enter that summary amount as the total amount for that ride. We will not be looking at the details of each individual rider for this calculation.
Repeat Steps 2-6 as necessary
Repeat steps 2-6 for each day of rides you want to enter into the spreadsheet. Once you’ve copied all your ride data into the spreadsheet, check out your values.
Check out Your Values!
Look at the Uber Percentage columns including the booking fee and excluding it. The Uber Percentage Excluding Booking Fee column used to always be 20% or 25%. What are you seeing there now? You will certainly see some rides where Uber’s take is higher than 25%, and you will most likely see some rides where their take is 0%. When it’s 0%, take a look at the Service Fee column. It will most likely contain a negative number. That means that Uber paid you more than it collected for that ride!
But the real numbers are the summary numbers in those columns in the green Totals rows on top. I was shocked to see my average number was less than 25%! I’ll talk more about that in my next article.
If you actually made it this far, I’d love to see your numbers. If you’d like to do so, share your spreadsheet with me by clicking on the Share button in the upper right-hand corner and share the spreadsheet with the email address you see in the image below (wcurtispreston@gmail.com).
Video: How to Calculate Uber’s Commission with Upfront Pricing
Here’s a video I recorded to help you follow along with the process:
Readers, what do you think of this strategy to see how much we make as drivers vs. Uber’s cut? Was this helpful, and do you have questions we can answer? Leave them in the comments below!
-Will Preston @ RSG