Lyft, Inc. is one of the most popular rideshare companies that connects customers with vehicle drivers, bikes, motorized scooters, and more.
Originally known for its quirky pink mustaches and casual attitudes, Lyft is now a publicly-traded company operating in 658 cities across the United States and Canada.
We’ve compiled the most important Lyft statistics for 2026 using our proprietary driver surveys, company data, and trusted third-party studies.
Key Lyft Stats
- Lyft’s 2022 revenue totaled $40.09 billion.
- Lyft has 25% of the ridesharing market share.
- In 2022, more than 45 million people used Lyft.
- Lyft operates in 646 American cities and 12 Canadian cities.
Fast Facts
- Founded: 2012
- Founders: Logan Green, John Zimmer
- Current CEO: David Risher
- Headquarters: San Francisco, CA
- IPO: March 29, 2019
- NYSE: LYFT
Related:
Financial Performance Stats
In this section, we’ll unpack Lyft’s financial performance, including its revenue, profitability, and EBITDA.
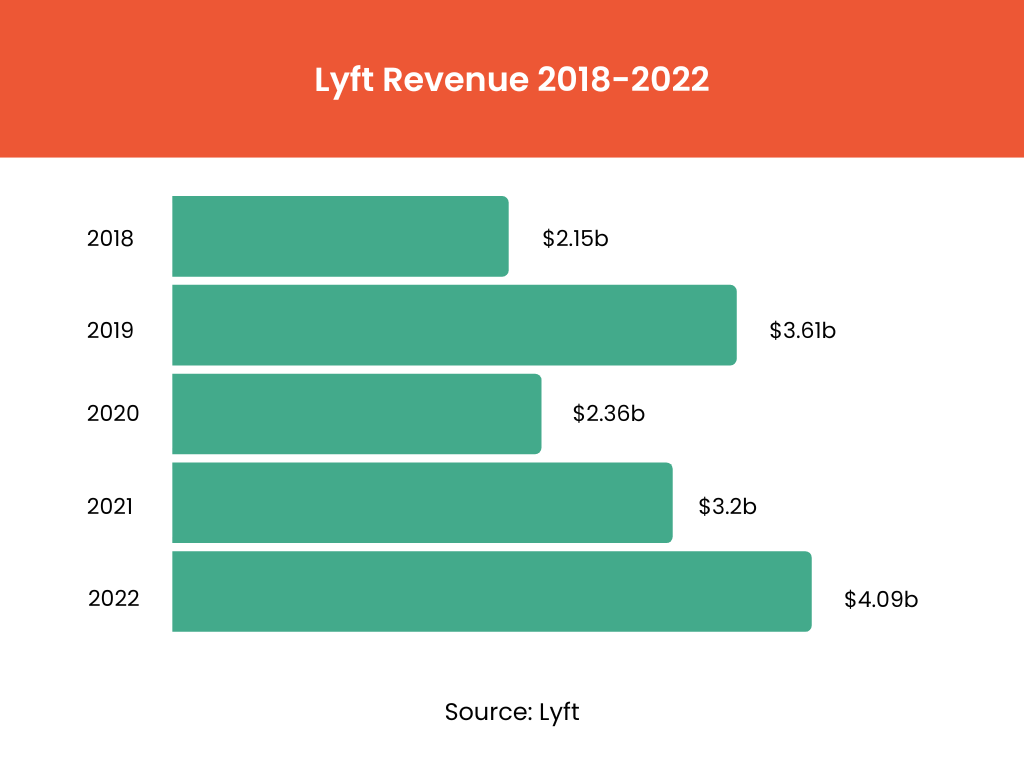
Lyft Revenue by Year
Based on Lyft’s financial reports, the company earned $40.09 billion in revenue in 2022.
Before 2022, the company saw its highest revenue in 2019, taking a hit in the following two years as a result of the pandemic.
Revenue Per User
Lyft also provides data on its average revenue per user (ARPU) each quarter. In the fourth quarter of 2022, the average Lyft rider brought in $57.72.
Here’s a look at Lyft’s Q4 ARPU for active users over the last five years:
| Year | ARPU |
| 2018 | $36.02 |
| 2019 | $44.40 |
| 2020 | $45.40 |
| 2021 | $51.79 |
| 2022 | $57.72 |
Despite fluctuations in overall revenue, Lyft’s annual revenue per user has steadily increased each year since 2018.
Profits/Losses
In 2022, Lyft reported that its earnings before interest, taxes, depreciation, and amortization totaled $127 million.
So, is Lyft profitable?
Company data shows that Lyft has never had a profitable year. In 2022, Lyft experienced a net loss of $1.6 billion. To compare, the company’s net loss the previous year was $1.1 billion.
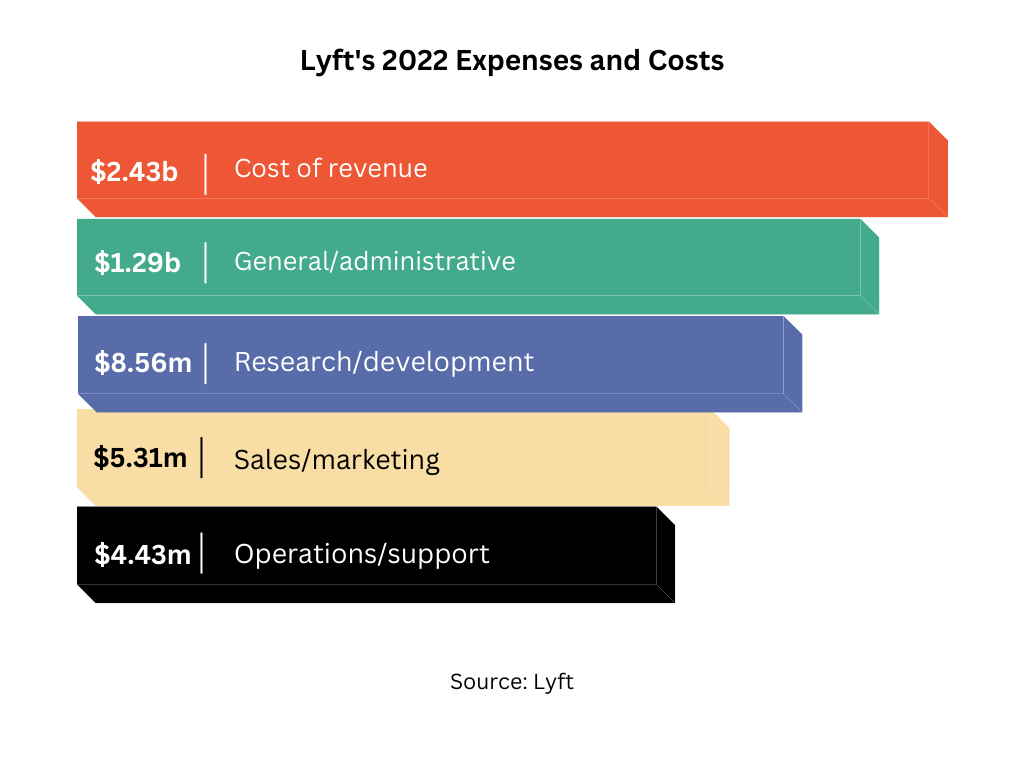
Costs and Expenses
According to its Q4 report, Lyft’s costs and expenses totaled $5.4 billion in 2022.
The cost of revenue and general and administrative expenses accounted for most of that amount, as you can see below.
Lyft Business Stats
Funding
According to Crunchbase, Lyft has raised $4.9 billion in funding since it was established.
The company has had 28 rounds of fundraising. The most recent round was a Post-IPO equity round in 2021.
Lyft is funded by 84 investors, including Fidelity, Manhattan Venture Partners, Comcast Ventures, and BluePointe Ventures.
Lyft Stock
Here are some key figures surrounding Lyft’s stock IPO from Crunchbase:
- Capital raised at IPO: $2.3 billion
- Valuation at IPO: $24 billion
- IPO share price: $72
Acquisitions
To date, Lyft has expanded its rideshare services by acquiring the companies below:
- FlexDrive (2014)
- Hitch (2014)
- Leo (2015)
- FinitePaths Inc. (2017)
- YesGraph (2017)
- DataScore (2017)
- Kamcord (2017)
- Motivate (2018)
- Blue Vision Labs (2018)
- Halo Cars (2020)
- PBSC Urban Solutions (2022)
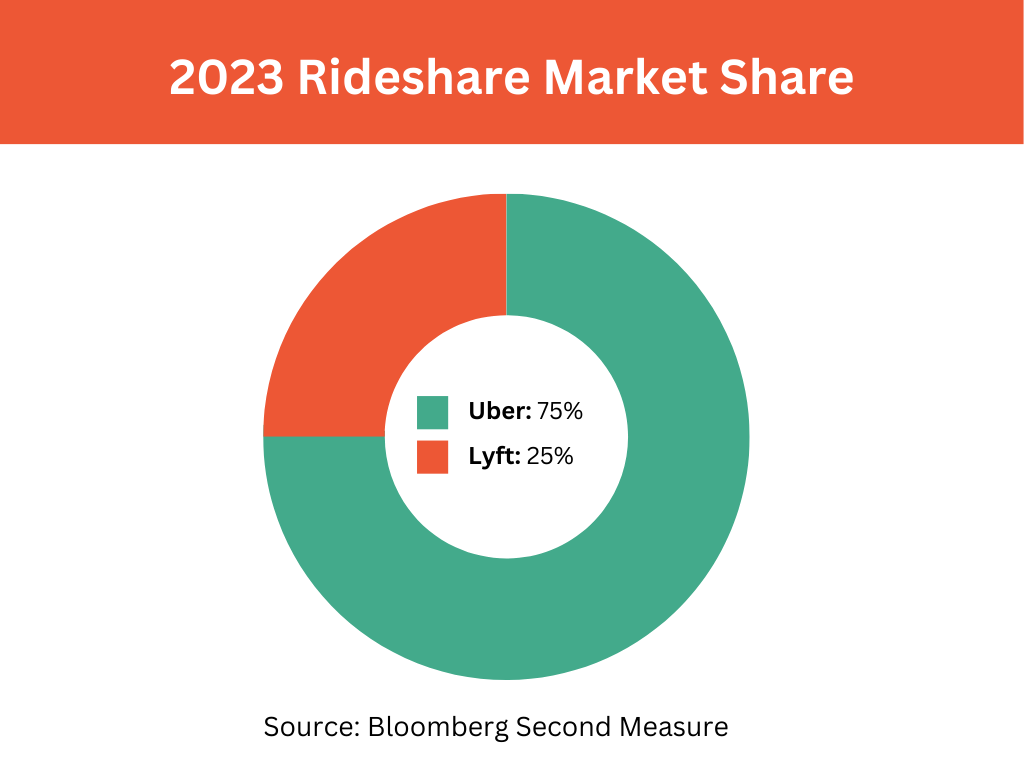
Lyft’s Market Share
Data from Bloomberg Second Measure shows that Lyft had 25% of the rideshare industry market share in May 2023.
The report also found that Lyft’s sales decreased by 6% year-over-year.
Lyft User Stats
Number of Lyft Riders
Lyft reported that it had 20.4 million active riders in Q4 of 2022, the most riders the company has had post-pandemic.
Lyft recorded its highest number of riders in 2019, with 22.9 million active riders. Take a look at the company’s annual rider count from 2018 to 2022:
| Year | Number of Riders |
| 2018 | 18.6m |
| 2019 | 22.9m |
| 2020 | 12.5m |
| 2021 | 18.7m |
| 2022 | 20.3m |
Rider Demographics
Lyft’s economic income report provides some insight into who uses the Lyft app. According to the report, here are a few demographics of Lyft users:
- Age: 49% of Lyft’s users are between the ages of 18 and 34.
- Income: The median household income for Lyft riders is $55,000.
- Education: 20% of Lyft’s active riders are currently students.
- Ethnicity: 47% of people who book Lyft rides are members of a community of color.
- Disabilities: Lyft estimates more than 3.5 million Lyft riders live with a disability.
How Riders Use Lyft
Curious about what riders use Lyft’s services for? Here are a few interesting usage stats from the 2023 economic income report.
- Car ownership: 38% of Lyft riders don’t lease or own a vehicle.
- Personal car usage: Of the riders that do, 30% use their personal vehicles less frequently because of their access to Lyft.
- Work: 36% of riders used Lyft to commute to work last year, and 18% used the ride-hailing service to get to job interviews.
- Healthcare: 84% of Lyft riders have used the platform to get to doctor’s appointments.
- Leisure: 58% of users booked rides on the platform to get to and from entertainment and recreation activities, and 44% used the service to get around on vacation.
- Biking: Lyft users biked over 91 million miles through Lyft’s bikesharing platform in 2022.
- Voting: Nearly 100,000 people used Lyft’s services to get to the polls to vote in 2022.
Lyft Driver Stats
Number of Lyft Drivers
Lyft doesn’t disclose how many drivers it has from year to year, but a recent report from Business News Daily suggests that Lyft has over 1.4 million drivers across the US and Canada.
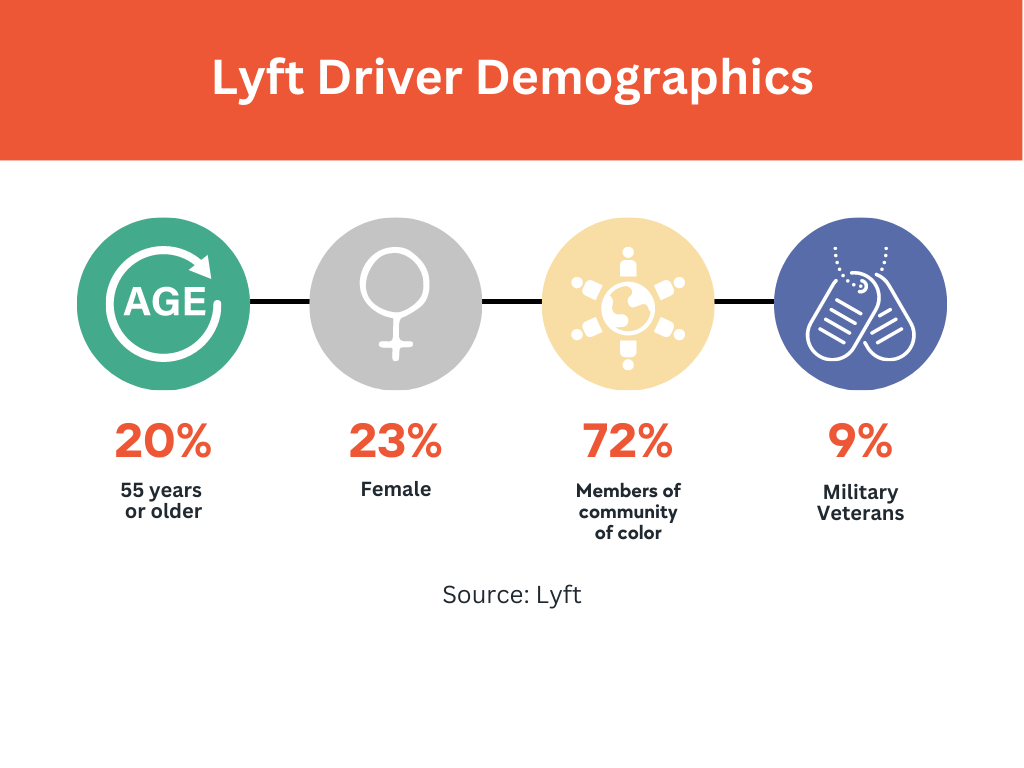
Lyft Driver Demographics
Lyft’s economic report also gave us a look into who drives for Lyft, providing some data points about the people who keep Lyft’s riders moving.
When it comes to age, 80% of Lyft drivers are below the age of 55. The majority of Lyft drivers are also men.
Driver Pay
What Lyft drivers actually earn is hard to pinpoint. Some drivers report their earnings before expenses like gas and insurance while others report earnings after expenses.
Earnings also vary by location. Drivers in busy cities like New York City, Detroit, Los Angeles, Phoenix, and Atlanta are likely to earn more than drivers in rural areas with less demand.
Each driver is given a rate card for what to expect in their area, with the base rate, per-mile, and per-minute earnings. According to our proprietary data, Lyft drivers reported earning around $17 per hour before expenses.
Lyft Driver Preferences
To enhance our Lyft and Uber statistics, we conduct an annual survey of over 10,000 Uber and Lyft drivers.
Our most recent survey revealed some interesting preferences among Lyft drivers. Here were the biggest takeaways:
- 71% of Uber and Lyft drivers prefer working as independent contractors, not employees.
- Lyft drivers earned an average of $17.49 per hour, which is slightly lower than Uber drivers.
- 5% of drivers said they work for multiple delivery and ridesharing apps.
- 54% of Lyft drivers said the company needs to do more to improve driver safety.
- 55% of drivers said the biggest way Lyft could improve their experience would be to increase pay.
- 9% of Lyft drivers say pay is the most important factor of their work, while 36.7% cited flexibility as their main priority.
- 9% of drivers say they’ve purchased rideshare insurance.
Related:
Bottom Line
Since its creation in 2012, Lyft has created competition for the leading platform Uber. With continued financial support from lenders and investors, Lyft may close the gap between Uber and itself in the coming years.
However, based on driver surveys, Lyft should continue implementing ways to keep drivers safe while on the job and make sure drivers are paid a fair wage.
The RideShare Guy is the largest and most respected publisher on the topic of Lyft.
We interviewed the former Lyft Chief Operating Officer on our podcast and YouTube channel (77,000 subscribers), and we reach more than 300,000 rideshare drivers per month across our media platforms.