Earlier this year, researchers at Stanford and working with Uber released an interesting study about driver earnings, driver retention, and the wage gap between male and female drivers. Today, senior RSG contributor Christian Perea breaks down the study for us and explains some of its conclusions. Let us know what you think about the survey’s conclusions in the comments below.
Researchers from Uber and Stanford recently released a study showing that women make 7% less per hour than men as drivers on the Uber platform. They also explained the reasons why there’s a difference.
But in addition to the gender wage gap, this study actually revealed A TON of data about driving for Uber between 2015 and 2017. This study revealed hourly pay for drivers, how many drivers there are, how driving experience affects hourly pay, and that about 70% of drivers stop driving within 6 months.
You see, getting to the conclusion of why women earned 7% less per hour than men required the economists to unpack a lot of other data about driving. I’ll outline some of the most interesting data points below.
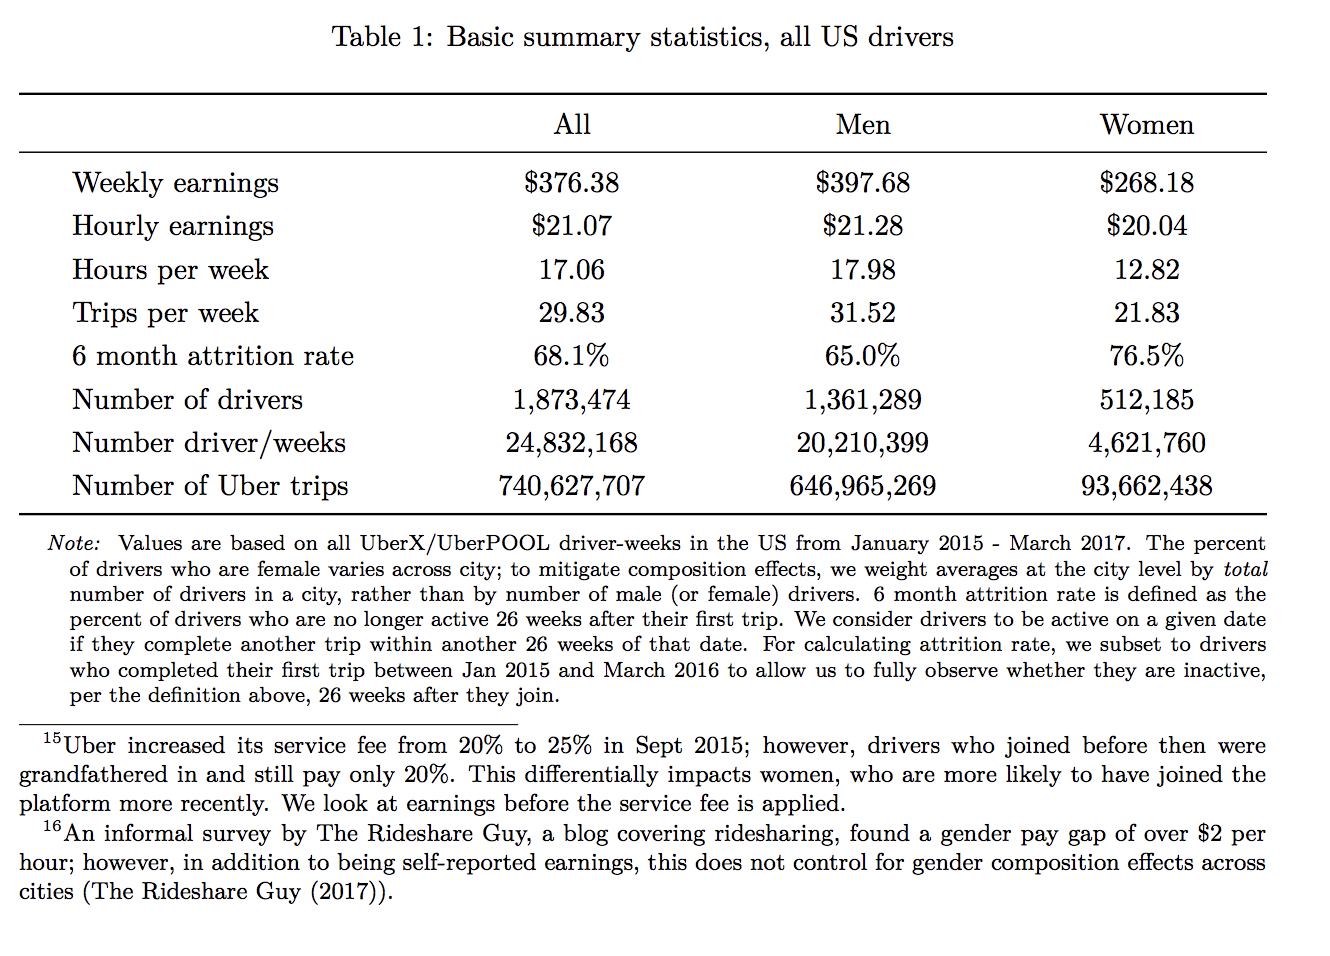
Uber Had 1,873,474 Drivers in February of 2017
But 68.1% of them quit within 6 months…

Within 26 weeks of giving their first ride, 65% of male and 76.5% of female drivers were considered inactive. But the numbers are probably even worse since it all depends on how you define an active driver.
You see, inactive drivers in the study were defined as those who hadn’t given a single ride in the last 26 weeks. If you went out and gave a single ride within that 26 week period, that “inactivity timer” would start over again. A lot of my friends have done one or two shifts in the last 26 weeks and I don’t know if that would make them “active drivers” in my book. More like stagnant drivers.
So Uber is retaining only 31.9% of its drivers after just 6 months, but due to their generous active driver definition, that number is probably even lower!
Average Hourly Pay Was Only Around $16/Hour
The study calculated the hourly pay for drivers as $21.07/hr in gross earnings but that is before Uber’s commission. So if we assume 20-25% commission, the gross earnings of drivers is a lot closer to $15.80-$16.86.
Related: How Does Upfront Pricing Factor Into All of This?
That’s still before gas, car washes, food, insurance, depreciation, etc. The study goes on to make an educated guess (page 38) that those costs come out to around $5/hour. This leaves us drivers with roughly ~$10.80-11.86/hr.
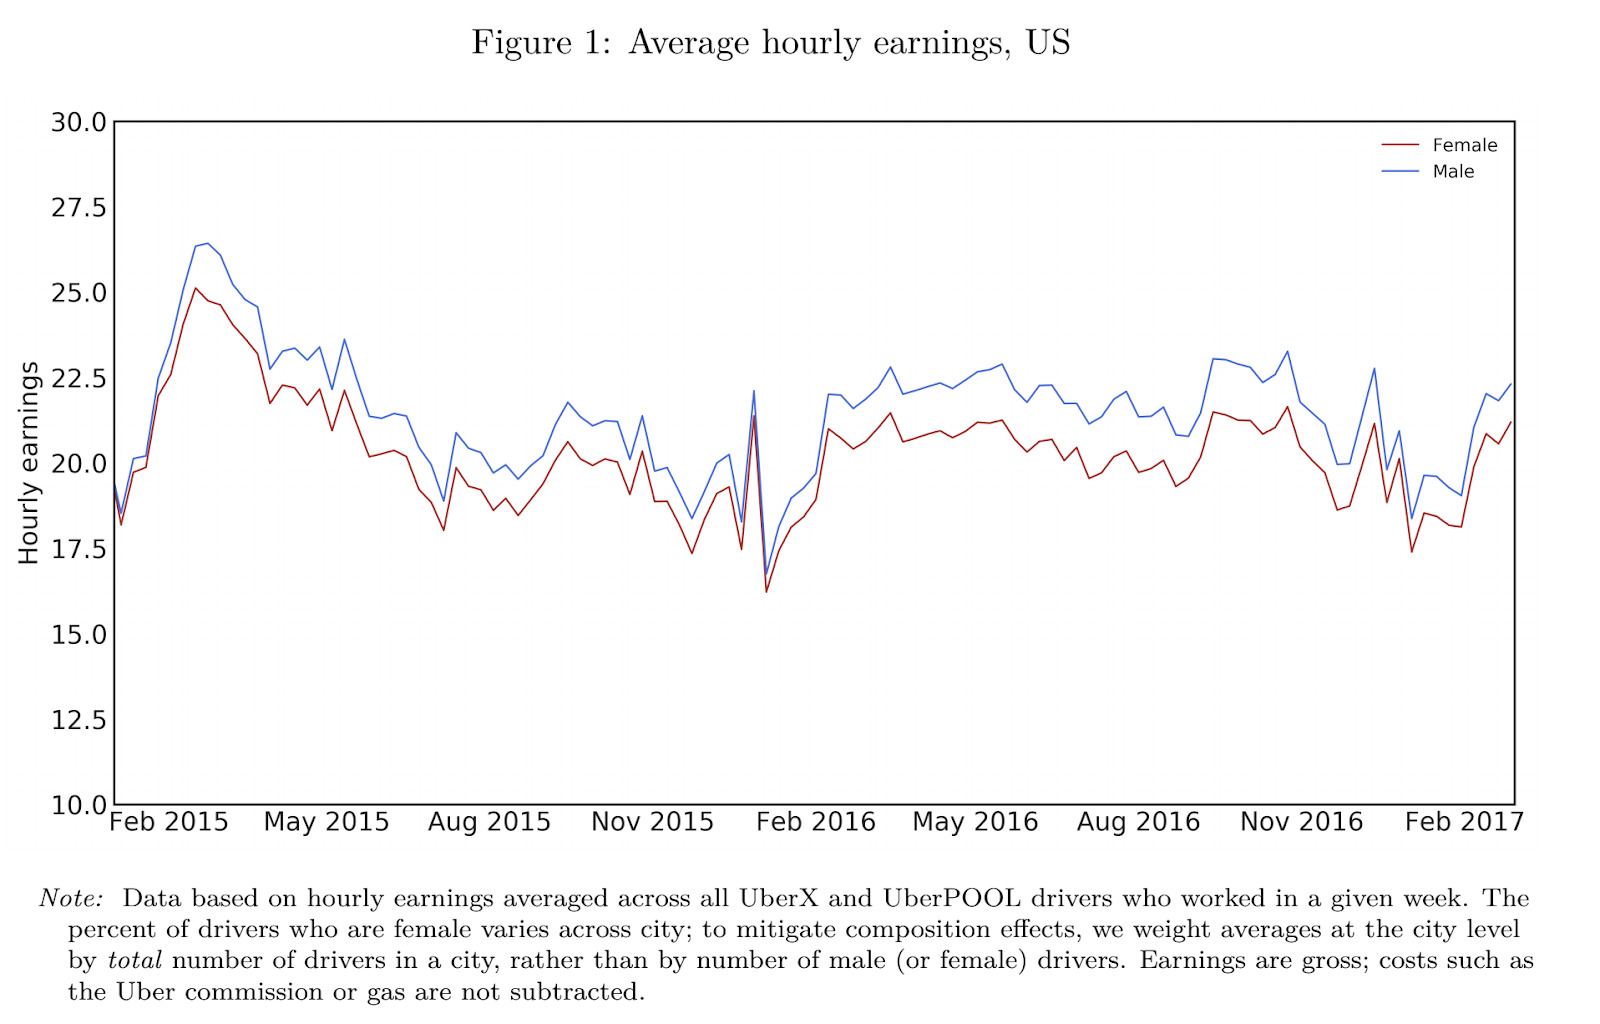
January Earnings Dip: Price Cuts or Seasonal?
Notice that January 2015 and January 2016 start off with a huge dip in hourly pay. In both of those years, Uber cut driver pay (the rate card) by about 15% nationwide. You’ll also see that pay dipped a lot in January 2017, so it’s unclear what portion of this is a result of seasonality or a result of drivers having their pay cut. It’s probably a bit of both.
In addition to seeing January dips, we see February spikes. Uber often launches pay promotions after cutting prices or as part of their old “Winter Warm-Up” strategy.
Winter “Warm Up” February 2015 – April 2015: During this period, Uber offered Average Hourly Guarantees and other incentives to drive after cutting rates in January. We would like to think that our article helped all of you “hack” them and contribute to the big increase on that graph 😉
Winter “Warm Up” February 2016 – April 2016: Uber offered hourly guarantees + Quest Earnings + Boost zones all at the same time.
Distribution of Driver Experience
One graph in this study took a look at the seniority of all the Uber drivers who gave a trip in January 2017. We see that most drivers have been driving for less than six months (week 26).
Also, a ton of drivers give up after their first month, which may be a combination of reaping the sign-up bonus or the experience not living up to expectations.
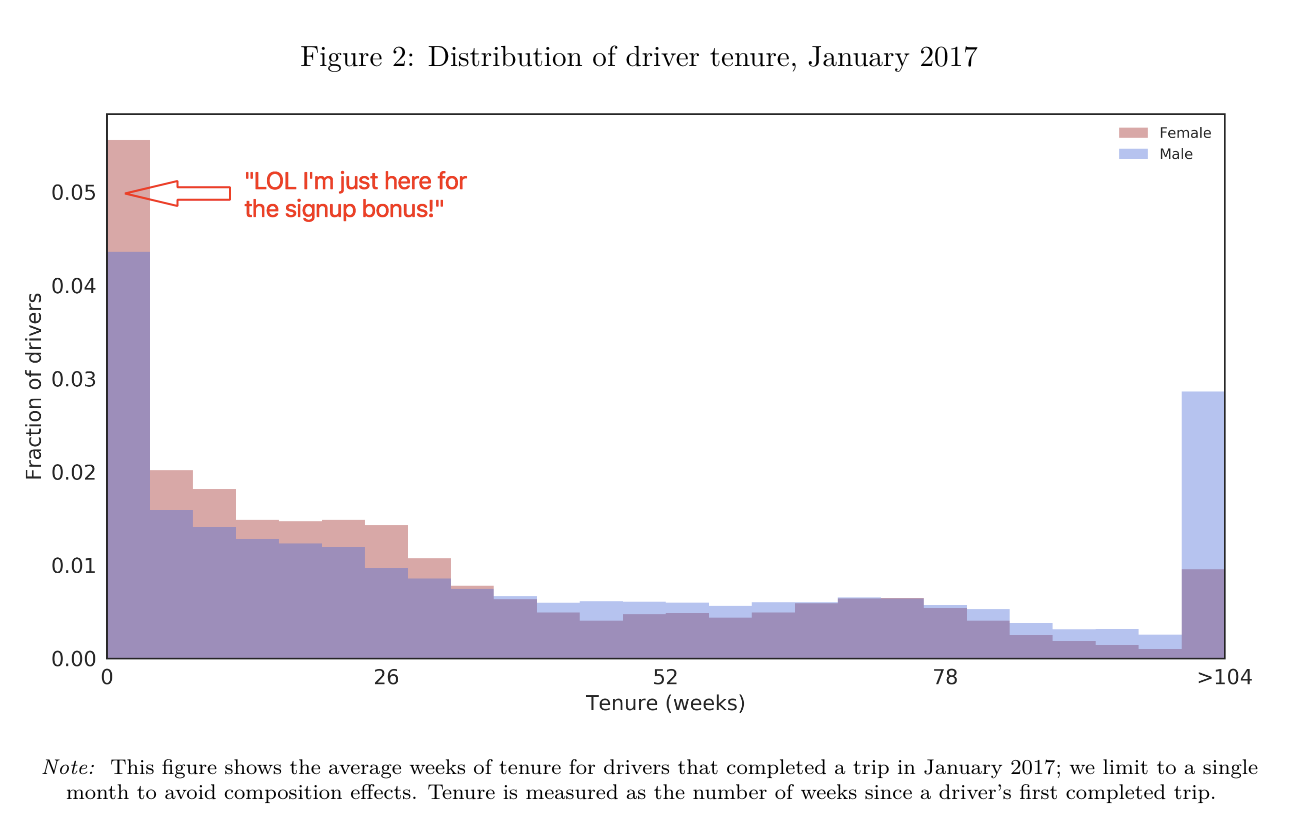
Veteran Drivers
This graph also shows a significant amount of drivers who have been driving for Uber longer than 2 years.
Drivers With 2500 Rides Earn 14% More Than Noobs
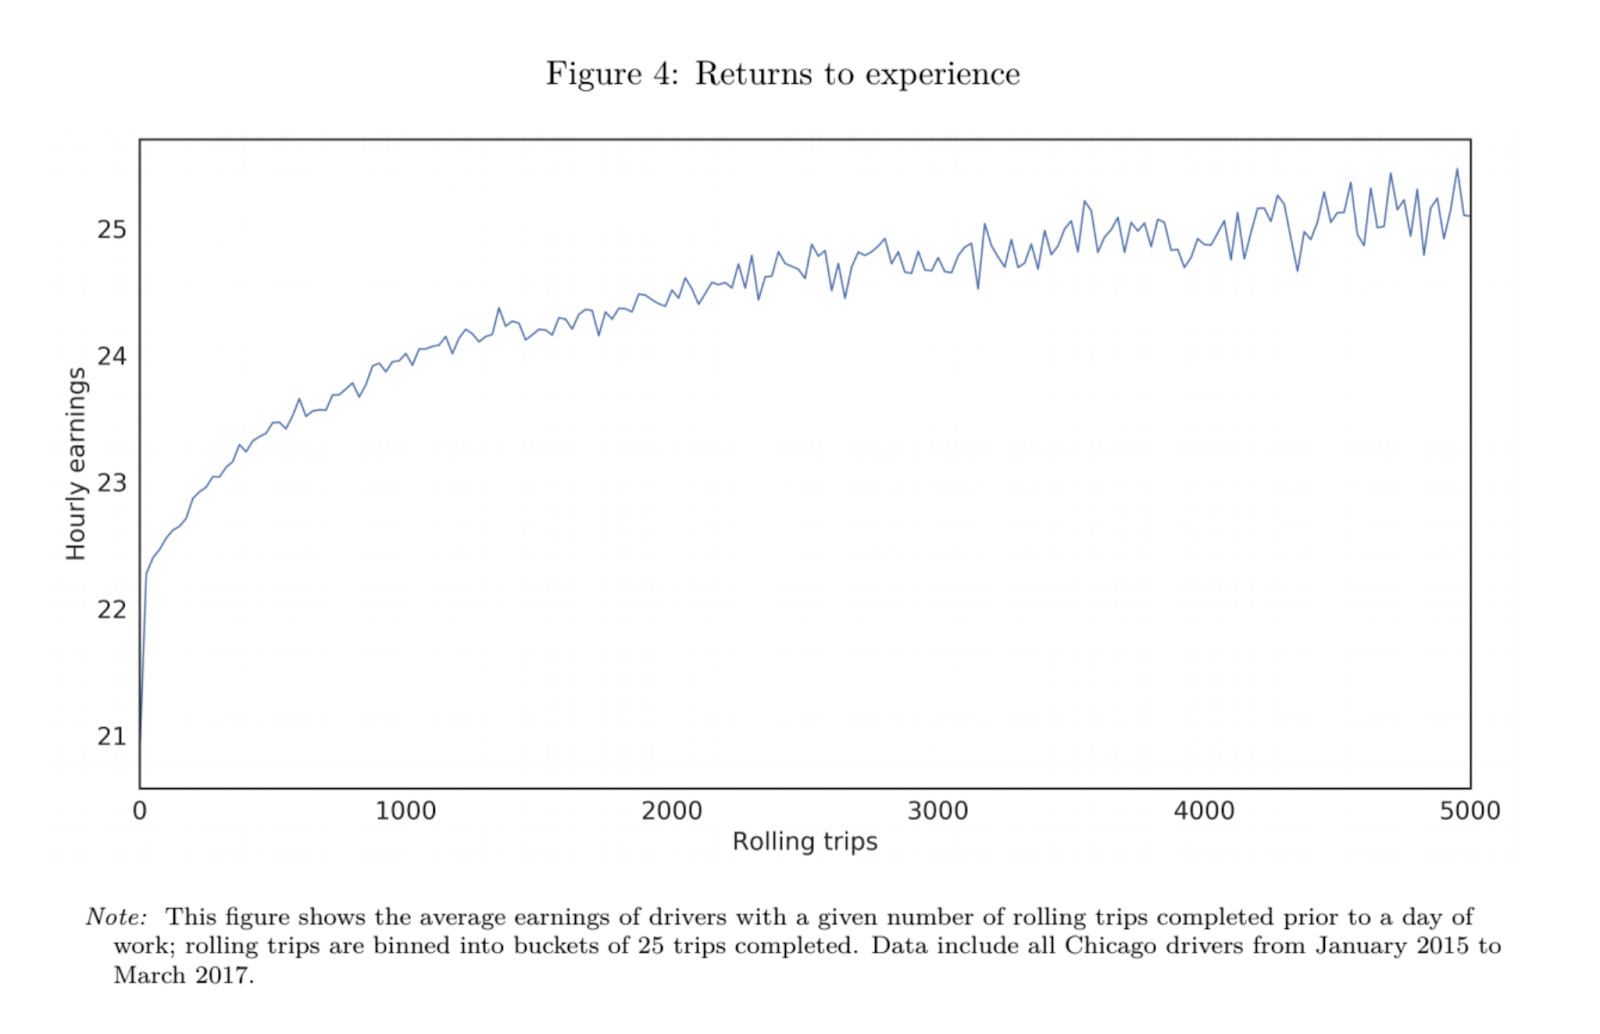
The Gender Gap study showed that those who had given 2500 or more rides earned on average 14% more than those with fewer than 100 rides (pg 18). It also showed that experienced drivers were more likely to cancel and reject their calls strategically.
Related: You Can Find Driving Strategies and More in The Rideshare Guide
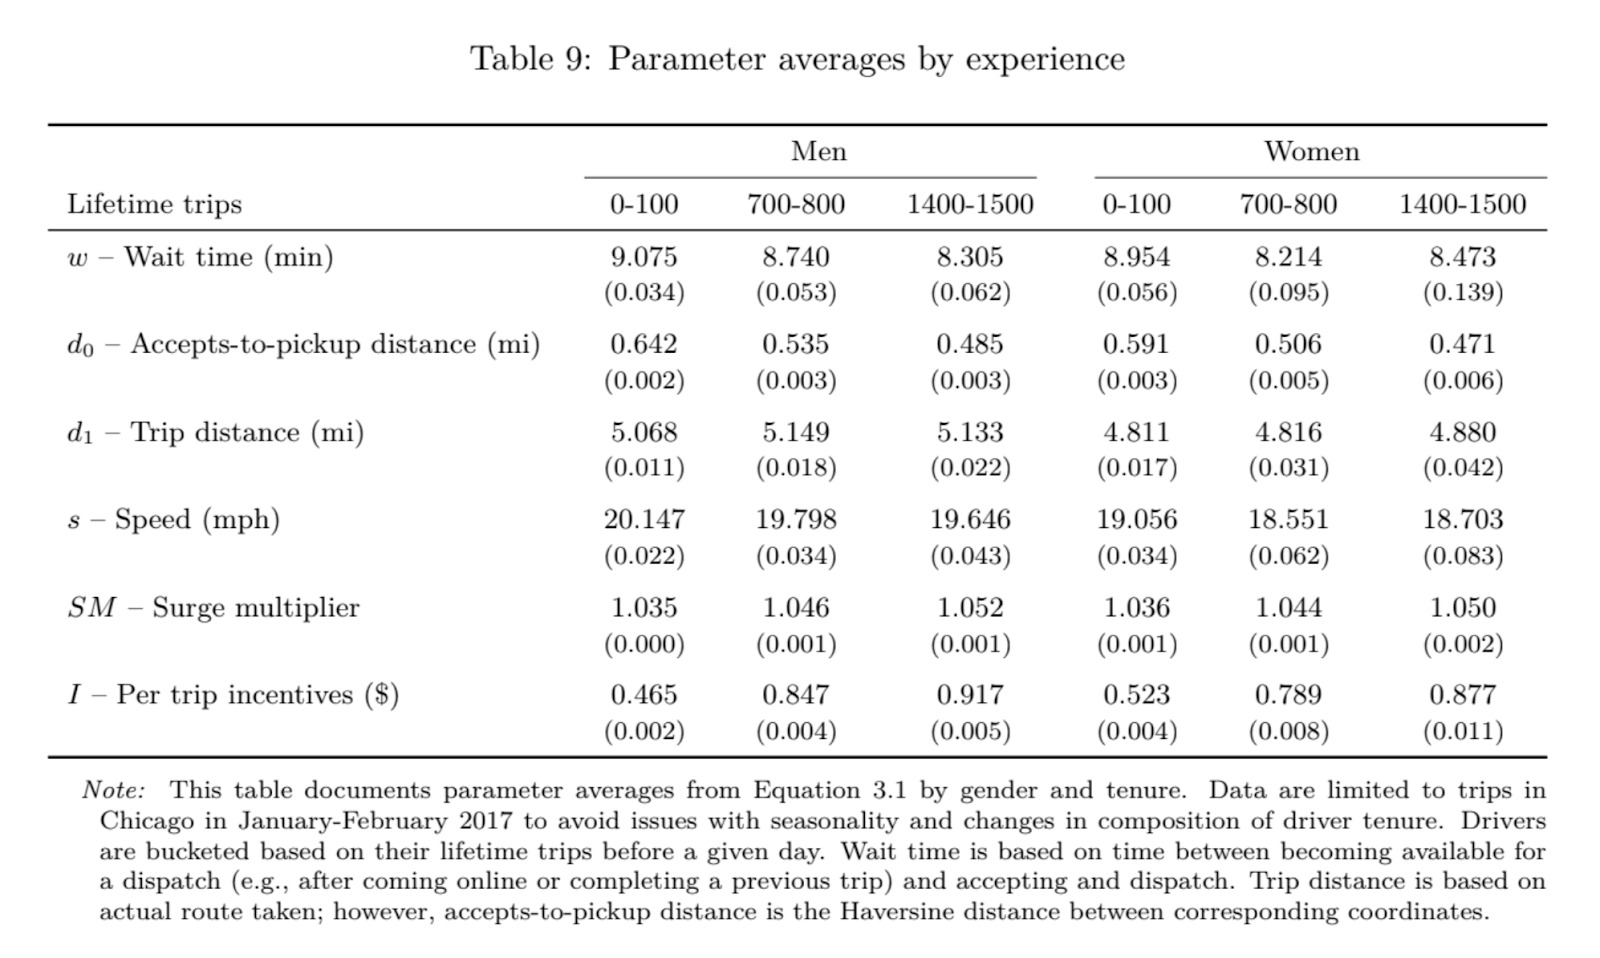
Noobs Wait Longer: The chart above shows that both men and women have lower wait times between rides as they progress in experience. This is probably a result of knowing where to go to get their next ride faster over time.
Selective Accepting: As drivers gained more experience, their distance from accept-to-pickup went down. I think this might be from selectively rejecting rides with long ETAs (like rides that are 15+ minutes away).
Selective Reject/Canceling: This is on page 21 of the study, but basically it covers how those with more experience cancel more often to avoid bad passengers and unprofitable rides.
There’s a complicated table measuring ride rejections. It’s kind of like a saltiness index.
Trip Distance: Although there seems to be an increase in trip distance, the difference is quite low, probably because we don’t have much control of that.
Speed: Men drove faster than women, but what I found surprising here was that as experience increased, average speed went down. The economists guess that more experienced drivers hangout in congested areas because they’re more profitable.
I like to think that more experienced drivers are just more relaxed though.
Surge: Apparently experience plays a part in getting surge pricing. What surprised me most though was that surge was such a small portion of all rides! Basically it was 1.03X surge.
Incentives: This is where experience seemed to really payoff. A driver with fewer than 100 rides only earned $0.465 in incentives on a per-trip basis while those at 700 trips and above earned almost 2x that at $0.917 (almost an extra dollar) per trip.
I think the big component to the 2x difference is because experienced drivers are likely to hammer out a lot of trips per week as full time drivers and in turn capture every available bonus.
The Gender Wage Gap & Safety
This study was unique because the giant pool of Uber drivers and the dispatch algorithm for Uber drivers is pretty much exempt from the type of gender discrimination that occurs in the traditional workplace.
I highly suggest checking out this episode of Freakonomics: What Can Uber Teach Us About The Gender Wage Gap. You can also get to the raw study here.
When the results came back with women still earning 7% less than men per hour as drivers, the researchers began to look into certain factors that contributed to this 7%. They found that it was partly a result of 1. time and place of work, 2. experience, and 3. driving speed.
Reason 1: Women Drive At Different Times and for Fewer Hours
Specifically, the study found that women drive a lot more on Sunday afternoons while men tend to drive more at night. The study also found men drive more hours in general.
This was explained away on the episode as “women are mom’s and stuff and have to get their kids from soccer practice and can’t drive as much as men” which sounds nice from an optics perspective but seemed to skip over another big factor: safety.
Apparently nobody considered anything like “feeling unsafe” as @8bitjess pointed out on Twitter:
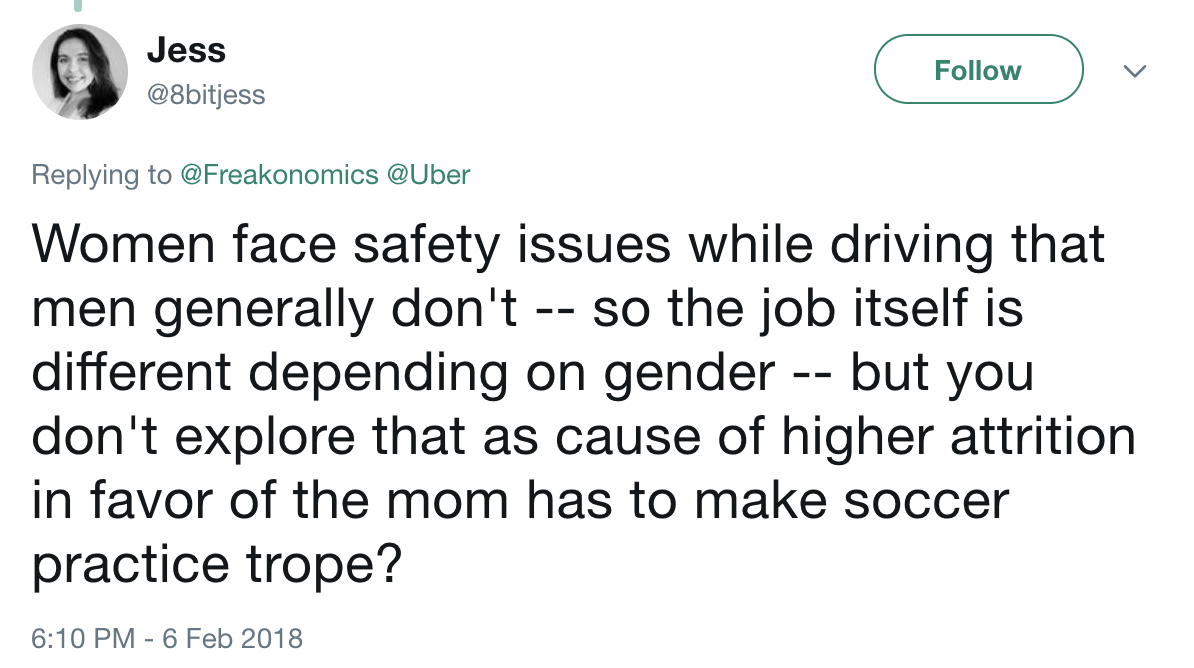
Not many of the female drivers I knew were raising kids. All of them however have been harassed at least once by a male passenger. Usually in the form of invitations to “come inside” after a ride, offers of cash for sex, unsolicited shoulder and thigh rubs while driving, or refusing to leave the car until she gave them her number.
Worse of all, most of these incidents go unreported and the few that get sent to Uber or Lyft had almost no follow-up outside of a canned email or phone call from Trust & Safety.
The worst nights are often documented via shaky voices in Voxer group chats, pings on Glympse, or commiseration with other drivers at a 24 hour diner at 3 a.m. over a series of chain-smoked cigarettes and crappy pancakes.
The study didn’t examine safety, and safety is a big (and obvious) issue. Safety also affects the second factor for lower earnings: experience. Both of those factors combined accounted for 50% of the 7% wage gap.
The Next Study: Tipping
The Ubernomics professor (John Hall) in the Freakonomics episode alluded to a study coming out about tipping. They also briefly discussed that since the implementation of tipping, women have been receiving between 10 and 20 percent more in tips than men.
He also claimed that we as drivers earn less with tipping because it “shifts the supply curve to the right”, aka brings more drivers onto the platform and lowers wages slightly.
Lol I’m sure it has nothing to do with Uber’s recruitment of drivers and that 68% turnover rate…
More on that later!
What did you find most interesting in this study? Let me know below!
-Christian @ RSG