Recently, Lyft announced it would be testing a Prime Time beta program for some drivers in Chicago. While not new (Lyft tried this new system in Tampa, FL, and Uber has made changes to its surge pricing), it isn’t until now that we had someone with firsthand experience write about this beta test. Today, we have a guest post from Mark Smithivas about Lyft’s Prime Time beta testing in Chicago.
Do you have a rideshare experience you’d like to share? Reach out and pitch me! You may see it featured here – and you’ll also receive a $50 Amazon gift card if we publish your article.
I’m a part-time rideshare driver in Chicago, IL who has been driving for over a year with 3,000 rides under my belt. When I first started I only drove for Lyft, but added Uber about 4 months ago to augment my earnings. Uber now represents about 85% of my rides now simply because I get more rides and better bonuses on that platform.
Last week, I got an e-mail from Lyft that I was selected to be in a beta test of a new heat map scheme. No details were given on how this new scheme would work, other than a vague promise that it would address some of the issues brought up from previous driver feedback about the current Prime Time maps. Lyft previously tested this new system out in a smaller market (Tampa, Florida) and there was some outcry from drivers there about it.
Basically, the new system deploys a flat-rate bonus instead of a percentage-based multiplier. So instead of seeing a map with 25, 50, or 100% Prime Time, you would now see a map offering anywhere from $5-20 fixed bonus for a particular ride.
I decided to give the trial a fair shot since it sounds like something Lyft wants to eventually roll out nationwide. (Note: Uber has also announced a similar scheme rolling out in selected markets as well).
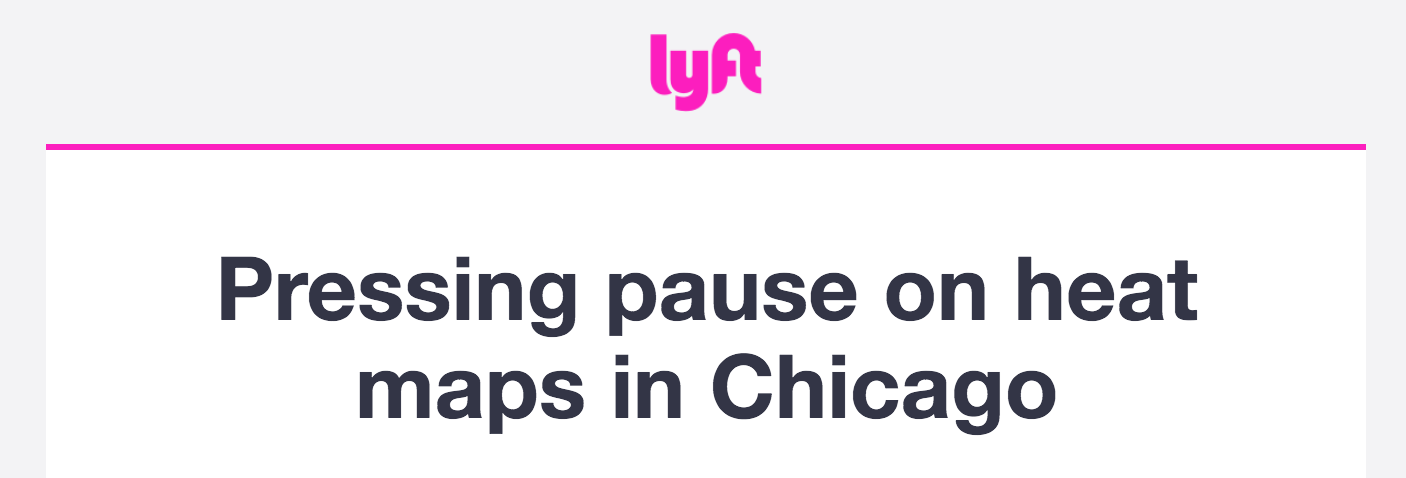
Update 6/5/18: Heat Maps on Pause
Heat maps are currently on pause in Chicago now per emails from Lyft:
Day 1 of the Lyft Prime Time Beta Test: Monday
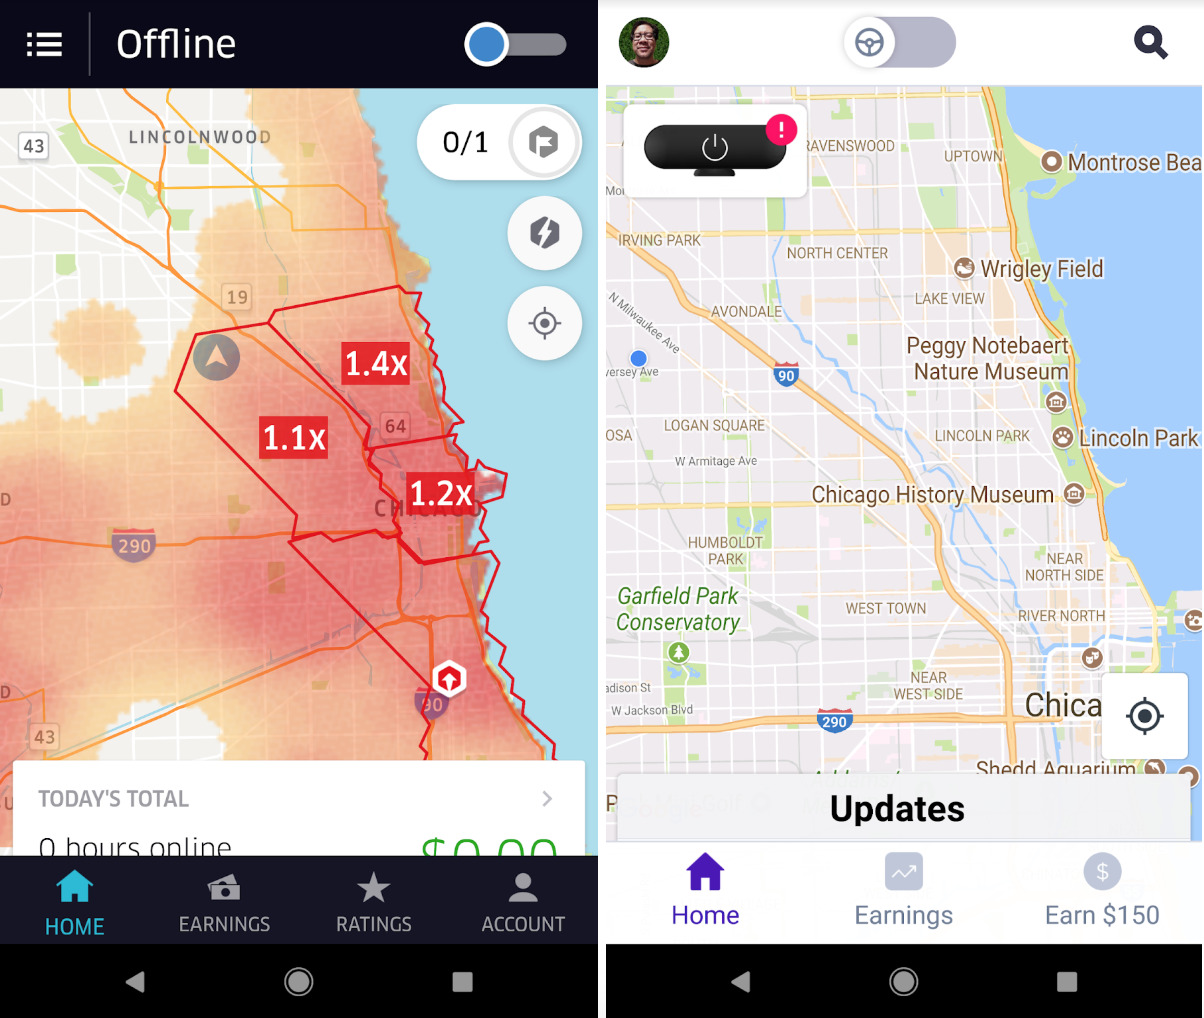
In most markets, Monday morning rush hour usually is a great time to work and earn. In Chicago, this was further accentuated by a torrential rainstorm throughout the morning. The regular heat map lit up, showing 200PT and up in the usual north side neighborhoods where white collar professionals live.
However, for those drivers opted into the trial, the entire map of Chicago was white. Even though Lyft had sent an e-mail notifying drivers they were involuntarily opted-into this trial, many were not aware of this until Monday morning when they saw no Prime Time whatsoever on their screen.
This quickly turned into a debacle as other drivers not in the trial posted screenshots in the drivers’ forums about the crazy morning rush hour rain Prime Time earnings. I’m not an academic research wonk, but it seems to me that running a trial when you can clearly see what those not in the trial are getting isn’t the best way to make a good first impression.
 Related article: Essential gear every rideshare driver should have
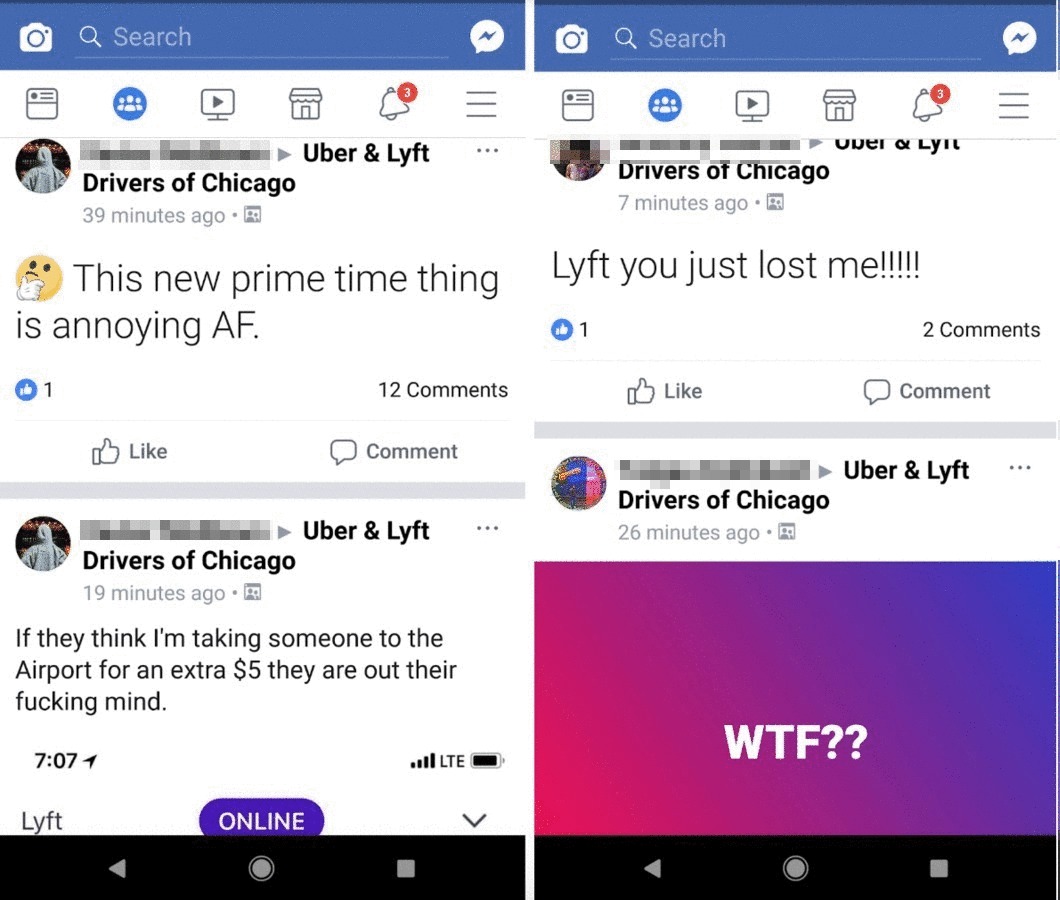
Drivers in the trial were cancelling rides or going offline in protest of the lack of Prime Time in this new heat map. I was not able to drive on Monday but saw the amount of anger expressed on the forums. Lyft could have done a much better job of on-boarding and explaining to the drivers in the trial how the new system would work before it went live and catching people off guard.
Day 2: Tuesday
Tuesday was a much more mellow day, with no bad weather or unusual traffic delays. However, in the evening were two major events: a Cubs night game and a U2 concert in the downtown area.
Normally, drivers like myself would position accordingly at these events hoping to catch a high Prime Time at the events’ end. I decided to just turn on the app and go all-Lyft to see what would happen. The first two rides were normal rate, but the second one got me close to United Center where the U2 concert was happening. Cool, I thought. But then the next ping took me away from there towards the downtown area.
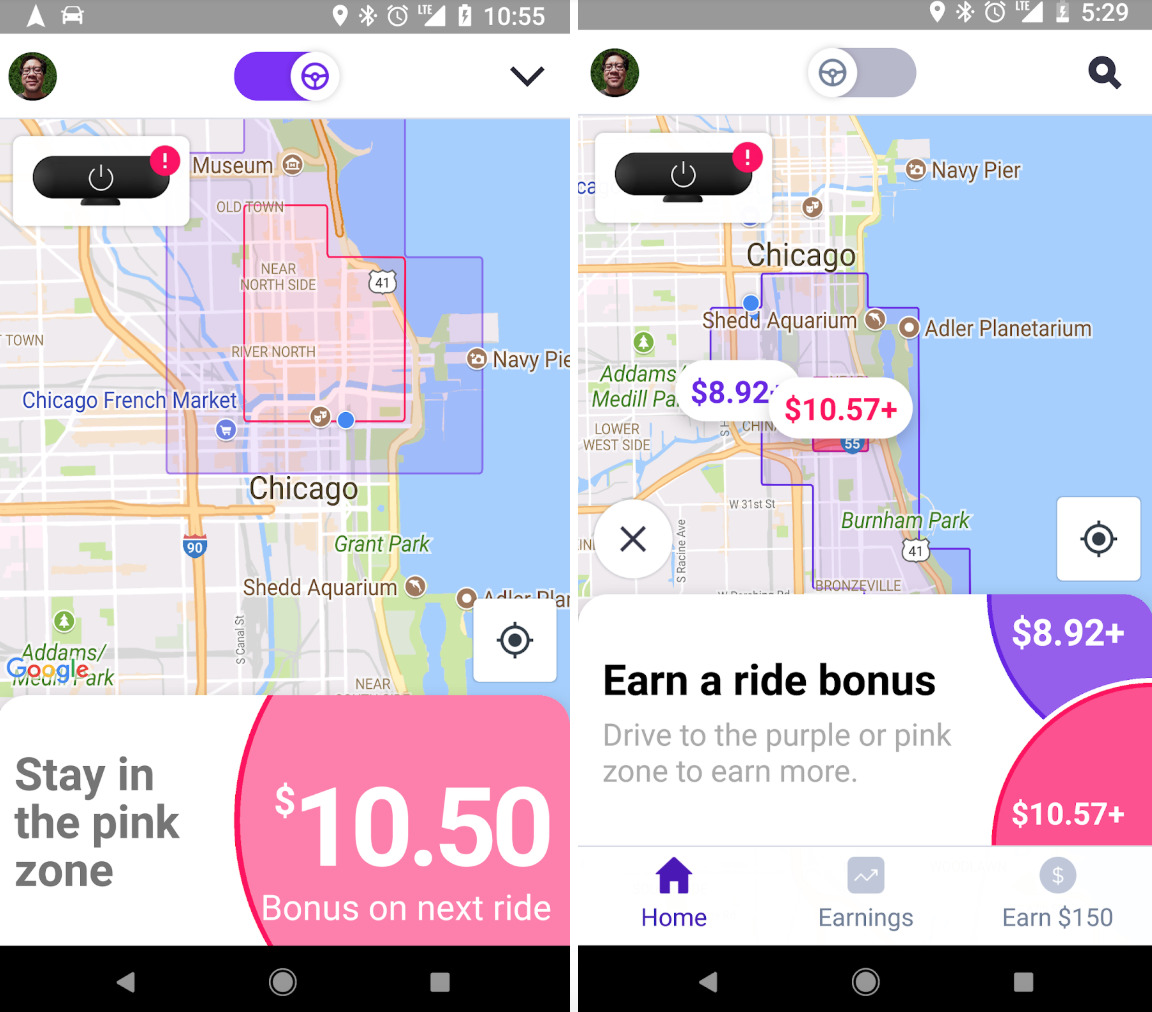
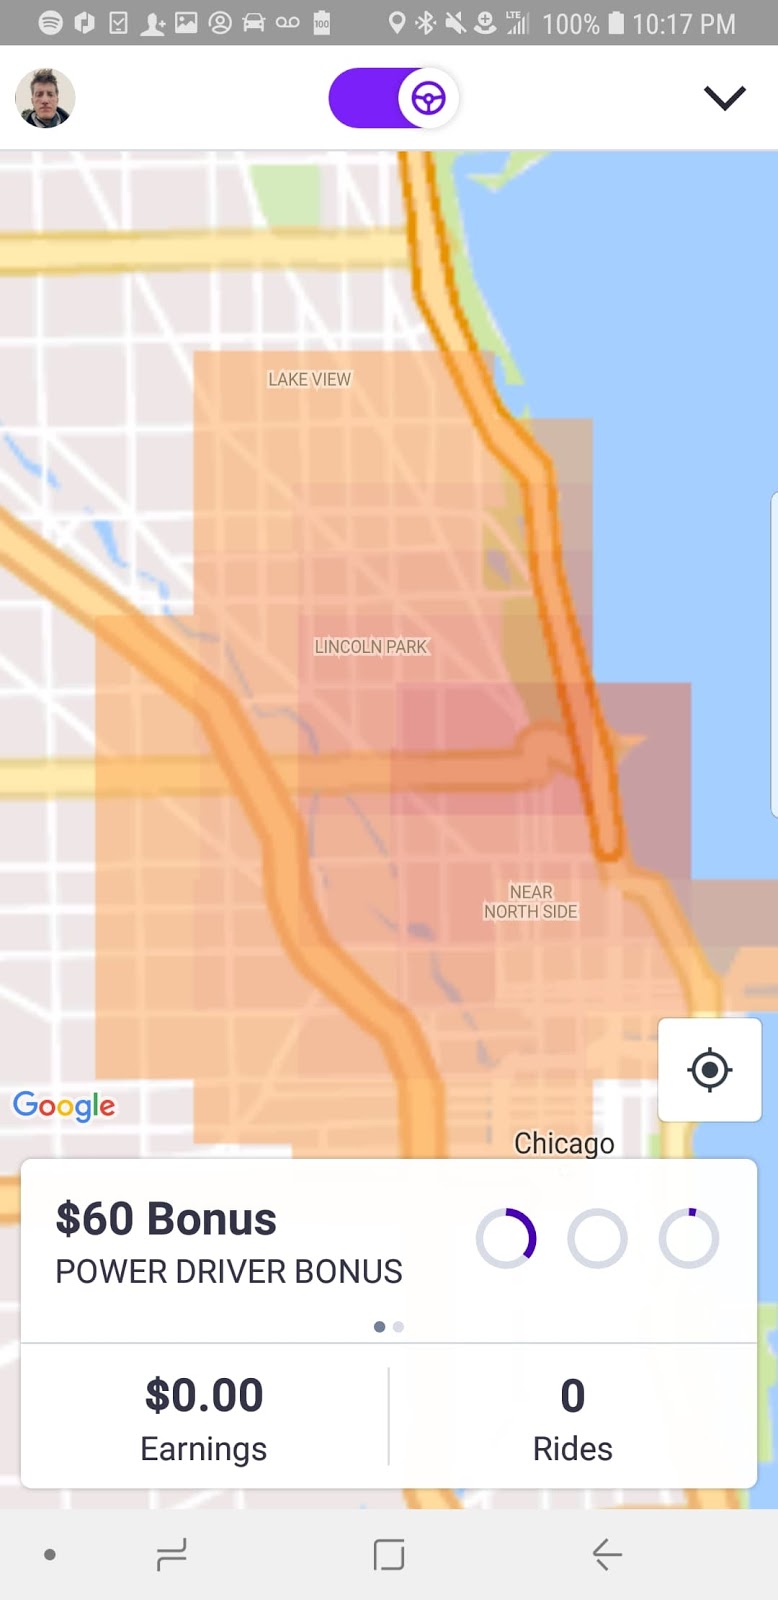
However, when I got there I finally saw the new heat map appear. As you can see from the screenshot, it covers a clearly delineated zone, with a higher bonus amount in the center. Once you are inside the zone, a bonus counter appears with an initial bonus amount the increases a few cents every 5 seconds.
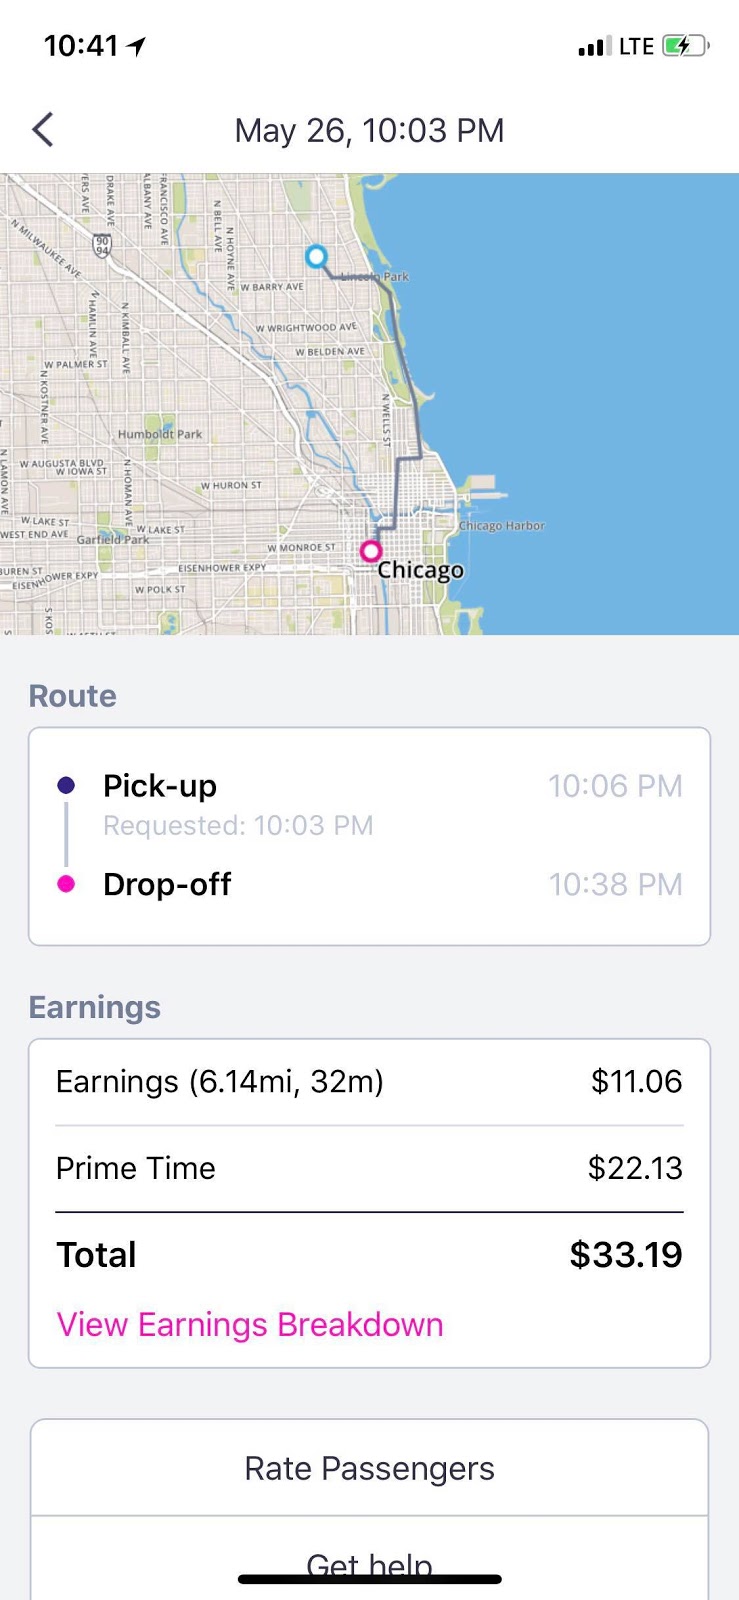
It didn’t take long before I got a ride inside this zone. The next few rides under the current system wouldn’t have been very profitable as they were very short, about a mile each. But because I was in the zone for all of them, I got bonuses of between $8 and $10 each time.
At the end of my shift, I had earned almost $100 after only 9 rides over 2.5 hours, which is not bad. $40/hr and very little mileage. Even though I missed out on any Cubs or U2 Prime Time rides, I did quite well and didn’t have to deadhead back from a long ride away.
Day 3: Wednesday
Wednesday night was similar to Tuesday, with again a U2 concert and Cubs game. I got a late start and headed towards the U2 concert. As I was on the highway, the heat map again appeared.
As I didn’t want to get stuck in post-concert traffic, I thought I’d try to stay on the edge of the heat map and try to get more short rides. Unfortunately, what I got was a passenger from the concert who was going a fair distance away, about 7 miles. Yes, I got another $8 bonus, but now I was outside the zone. After dropping off downtown, I was disappointed to see no more heat maps for the rest of the evening.
This points out a huge drawback. According to Lyft, only one heat map can appear at a time, and only when you are near it. In the current system, where all drivers can see Prime Time happening anywhere on the map, this helps one plan and strategize, as well as gauge the underlying demand.
In the new heat map, it’s like driving while blind. You don’t know the underlying demand and even if you did, the heat map may not appear as Lyft says it’s customized to each driver. As drivers in the trial started to figure things out, a number actually started using the Uber app as their guidepost to see where surge was happening so they could navigate accordingly when on Lyft.
I am of the belief that providing more information and control helps drivers be more successful, so taking information away and making it a guessing game isn’t something I think is good for the platform.
Day 4: Friday
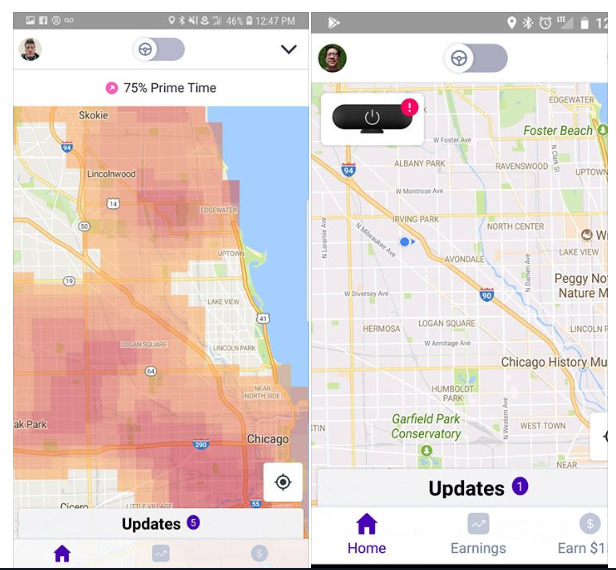
I took Thursday off, but on Friday I decided to check the situation as it was the start of the Memorial Day long weekend. As expected, Prime Time began early as people left work early, but on my map, it was stark white. On Uber, it was surging as high as 2.4 in my neighborhood, but no heat map appeared for me on Lyft.
I checked in with a driver friend not in the trial and his screenshot showed deep red Prime Time zones all over the city, including where I was. At one point I even logged in and waited for pings to arrive, but none were under a bonus offer and no heat map appeared even while driving around a bit.
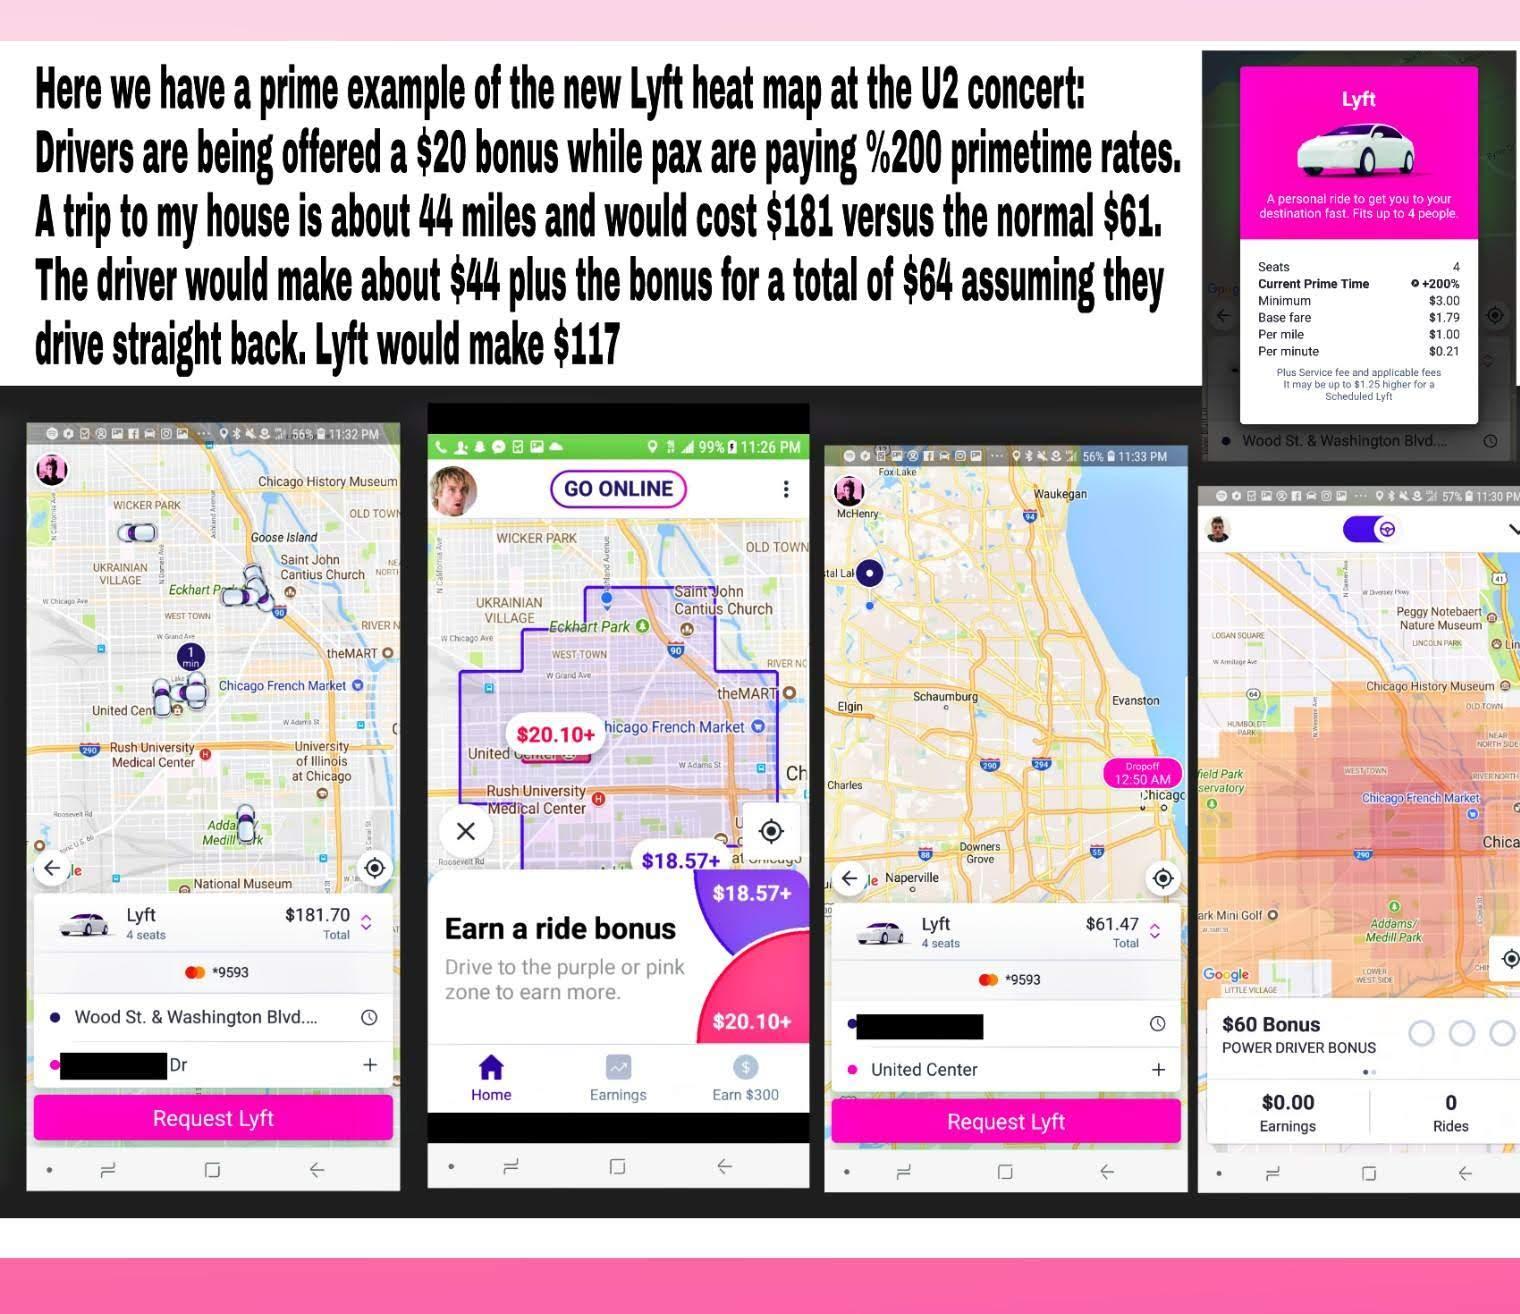
As the trial progressed during the week, one other major issue became evident: Lyft was making bank on Prime Time from customers. Drivers began doing their own analysis and seeing how with upfront pricing, Lyft could still charge customers a premium, yet now the drivers in the trial would only get a few dollars.
The disparity between what a customer pays and what a driver earns was astonishingly evident under this new heat map scheme. This further contributed to the perception that the new heat map scheme is a ploy to simply increase Lyft’s share of the profits rather than help drivers make more money.
Day 5: Saturday
This was the most telling night of testing. It was a warm, humid, holiday weekend evening. I drove over to Wrigley Field right after the game ended. As you can see by the first screenshot, there was clearly Prime Time. However, I did not receive any heat map bonus and instead took a flat rate ride.
After the ride concluded, I looked at the fare breakdown and saw this:
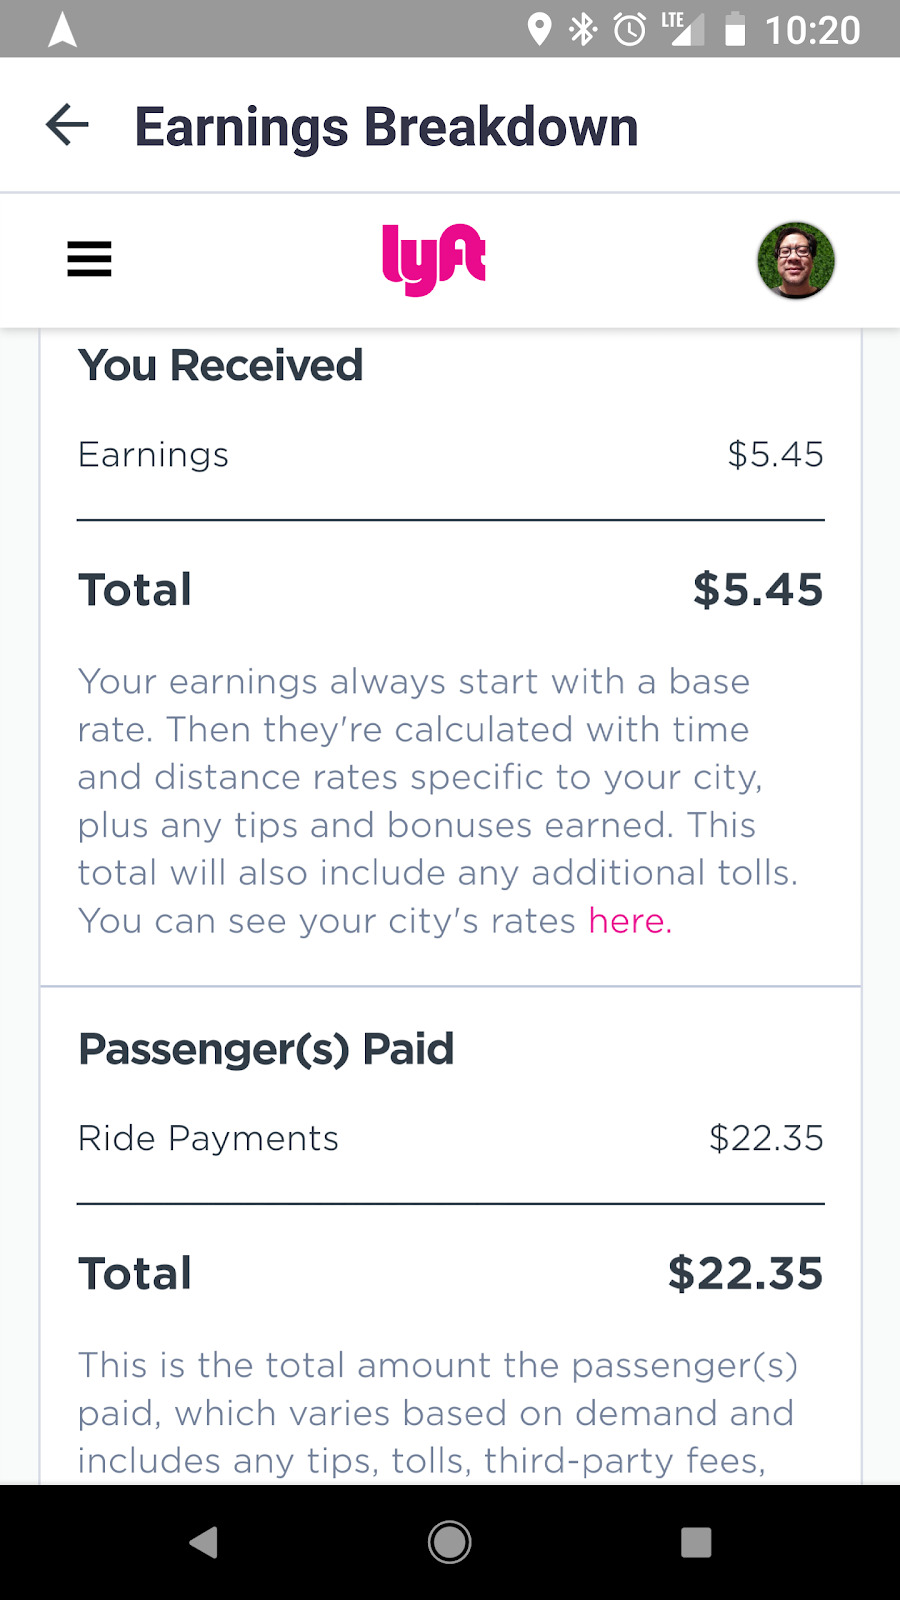
Clearly Lyft had charged this customer Prime Time rates, but none of that was passed onto me – the driver. Another driver not in the trial shared this screenshot from her ride, also originating from the Wrigley area around the same time.
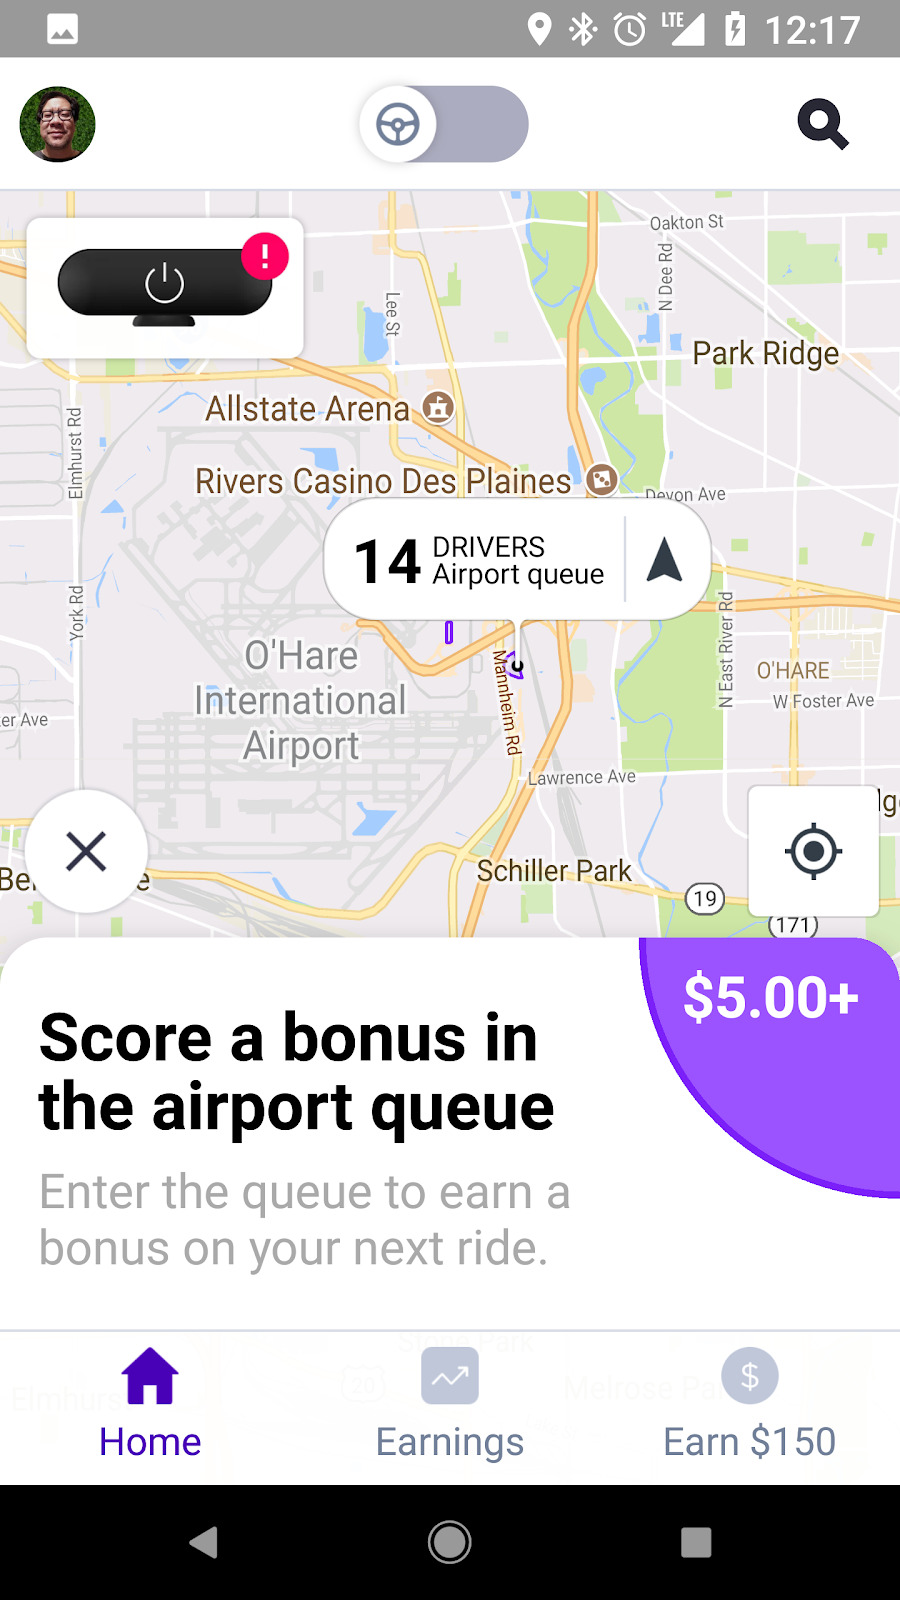
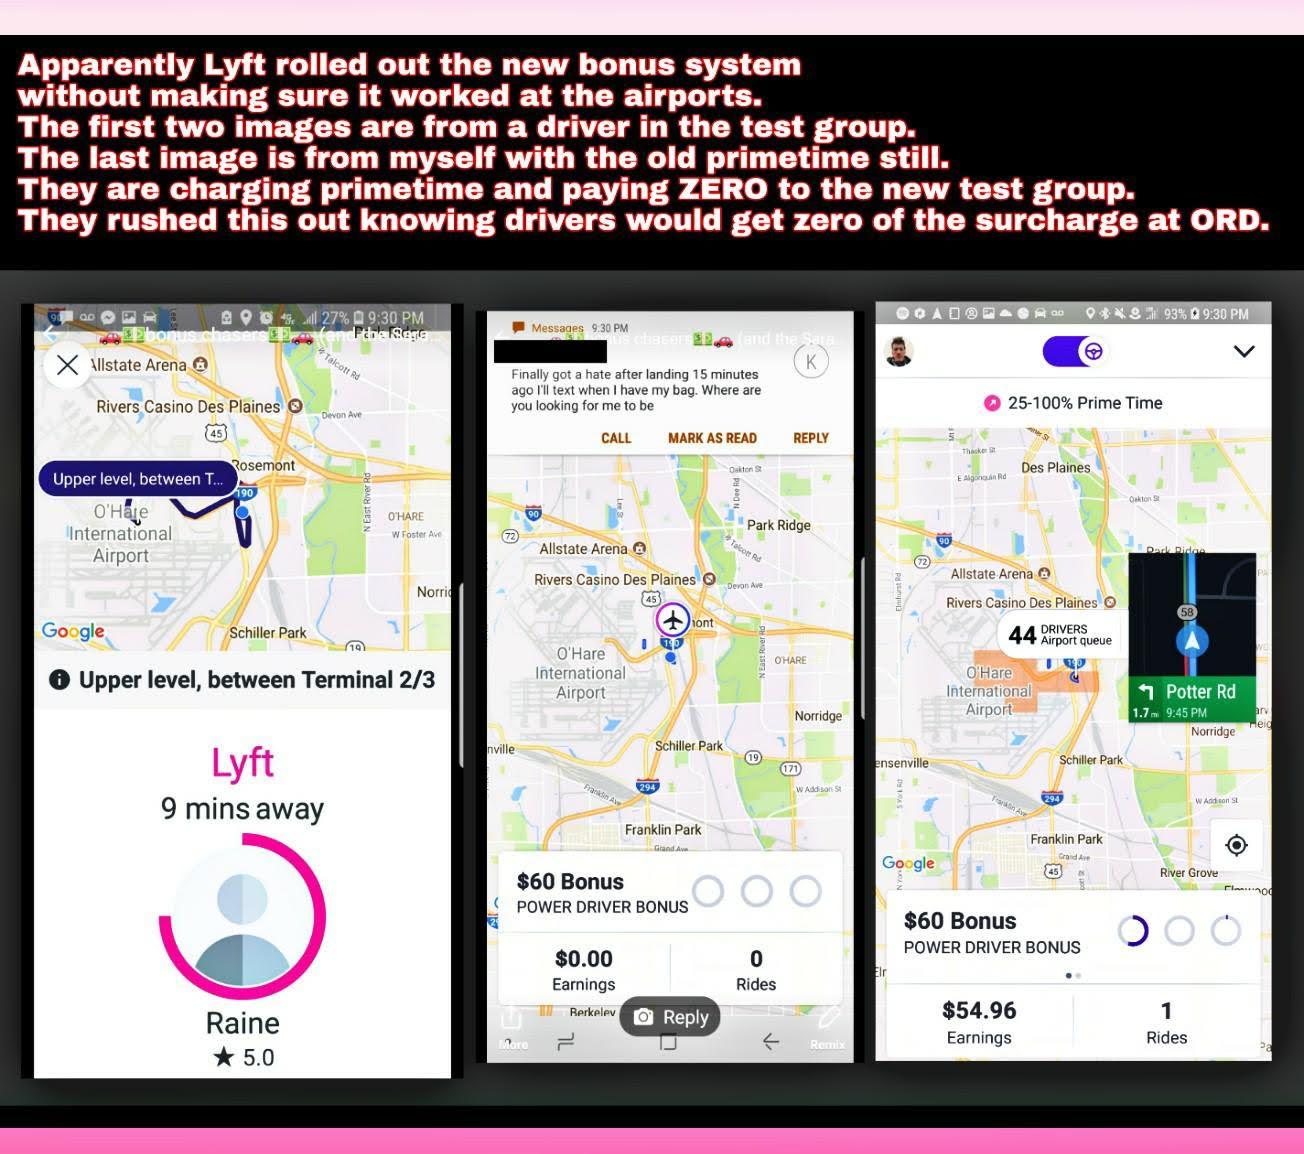
I am puzzled why Lyft chose to conduct a trial like this when clearly drivers can see that some make significantly more money on a ride than others. Finally, the last screenshot below shows the bonus offered at the airport. This bonus never appeared until now during my entire week of testing.
You can see that there are only 14 drivers in queue, quite a low number. What this suggests is that the threshold for an airport bonus was set too low, since there are few times during the week when the queue drops that low. And frankly, a $5 bonus is a pittance compared to what a driver would make under a 25 or 50% PT.
With any major change, there will be natural resistance and pushback simply because people are used to how things work, so to teach an old dog new tricks can be challenging. Veteran drivers who have perfected a “surge chasing” system will not be able to do things the same way if this rolls out to all drivers.
The new system favors drivers who simply turn on the app and accept all trips. In fact, the shorter the trip, the better under this scheme. Instead of hunting for a Prime Time, out-of-state unicorn ride, the new unicorn will be a 1-mile or less shortie that keeps you in a bonus zone. No one will want to do an airport ride during rush hour anymore.
Overall Thoughts
I tried to approach the week’s trial with an open mind. Although I didn’t care for being involuntarily opted into a trial, I thought I might as well get a taste for what’s likely to get rolled out to the masses soon.
I got decent results on the first night of testing, but after that, the heat maps never displayed consistently where they should have appeared. I’m not a guru statistician, but it seems to me rolling out a trial when the participants can see how well regular riders are doing at the same time would skew the results to the point where conclusions are meaningless.
I saw several posts online from dejected drivers who, upon opening the Lyft app and seeing all white, decided it wasn’t worth it to drive for the day. Indeed, there may be some skewing on the non-trial side, since if drivers in the trial log off en masse, it may create disproportionate Prime Time for regular drivers.
Of course, Lyft isn’t being transparent about any of this, or what metrics they are looking at. But if heat maps don’t display with the same predictability as regular Prime Time does, I can’t imagine it being successful in the long run for drivers.
Updated: Lyft saw this article and released a statement:
“We appreciate Mark’s thorough examination of this very early heat maps beta feature, and this type of candid feedback from him and other drivers is exactly what we’re looking for as we continue to test and iterate on its functionality. Our team is working hard to address these and other comments ahead of a broader rollout to ensure we have the best possible product for our community.”
— Laura Copeland, Head of Driver Communications and Community
Have you been a part of the new Lyft Prime Time beta test and want to share your perspective? If not, what do you think about this potential change to Lyft’s Prime Time?
Mark is interested in how technology and game-based learning can change our school system. He is also a blogger and podcaster and maintains a rideshare related blog and podcast when he is not driving his two children to after-school activities.
Related article: Essential gear every rideshare driver should have