Every year I send out an annual Lyft and Uber driver survey to our email list of 60,000+ drivers for the best gig jobs (including the best delivery services) and eagerly await the results. Even though I’ve talked to tens of thousands of drivers over the years via email, social media, phone and in person, it’s always good to add some quantitative data to those conversations. And it seems like every year, there are a few major findings that surprise me – this year was no different.
Periodically throughout the year, we will survey drivers from our email list and social media channels (make sure to sign up for our newsletter if you want to share your opinions!) on topical or hot button issues. Reach out to Harry if you’re with the media or academia and would like more information.
You can find our latest surveys here:
- Our latest W2 vs. Independent Contractor Survey shows 71% of Drivers Want to Remain Independent Contractors
- How has the coronavirus impacted drivers? Fewer drivers are on the road, and drivers do not feel like Uber/Lyft is doing enough
- What drivers think about California’s Proposition 22
In 2019, we collected nearly 1,000 responses from drivers across the country and added a few new questions that we’ve never asked before. Obviously this was a big year for both Uber and Lyft since the companies went public, but what effect did that have on drivers? Interestingly, Uber drivers actually reported higher earnings in 2019 than 2018, but driver satisfaction was down by 10%. We also asked drivers about their expenses for the first time this year and found that expenses knocked earnings down by around $6 per hour.
Since employee status for drivers has been such a polarizing topic in 2019, we asked drivers how they felt about the situation and 66% of drivers reported that they want to remain independent contractors.
If you’d like to learn about the methodology, please check out the official report. And if you’re a member of the media or academia interested in covering any of these findings, please reach out to me harry[at]therideshareguy.com for a full question list and raw data. If you’re a consulting client and would like to review the results, you can contact me directly: harry[at]therideshareguy.com
Uber Surveys Drivers in 2020
Update 2020: 60% of California Drivers Are ‘For’ Proposition 22
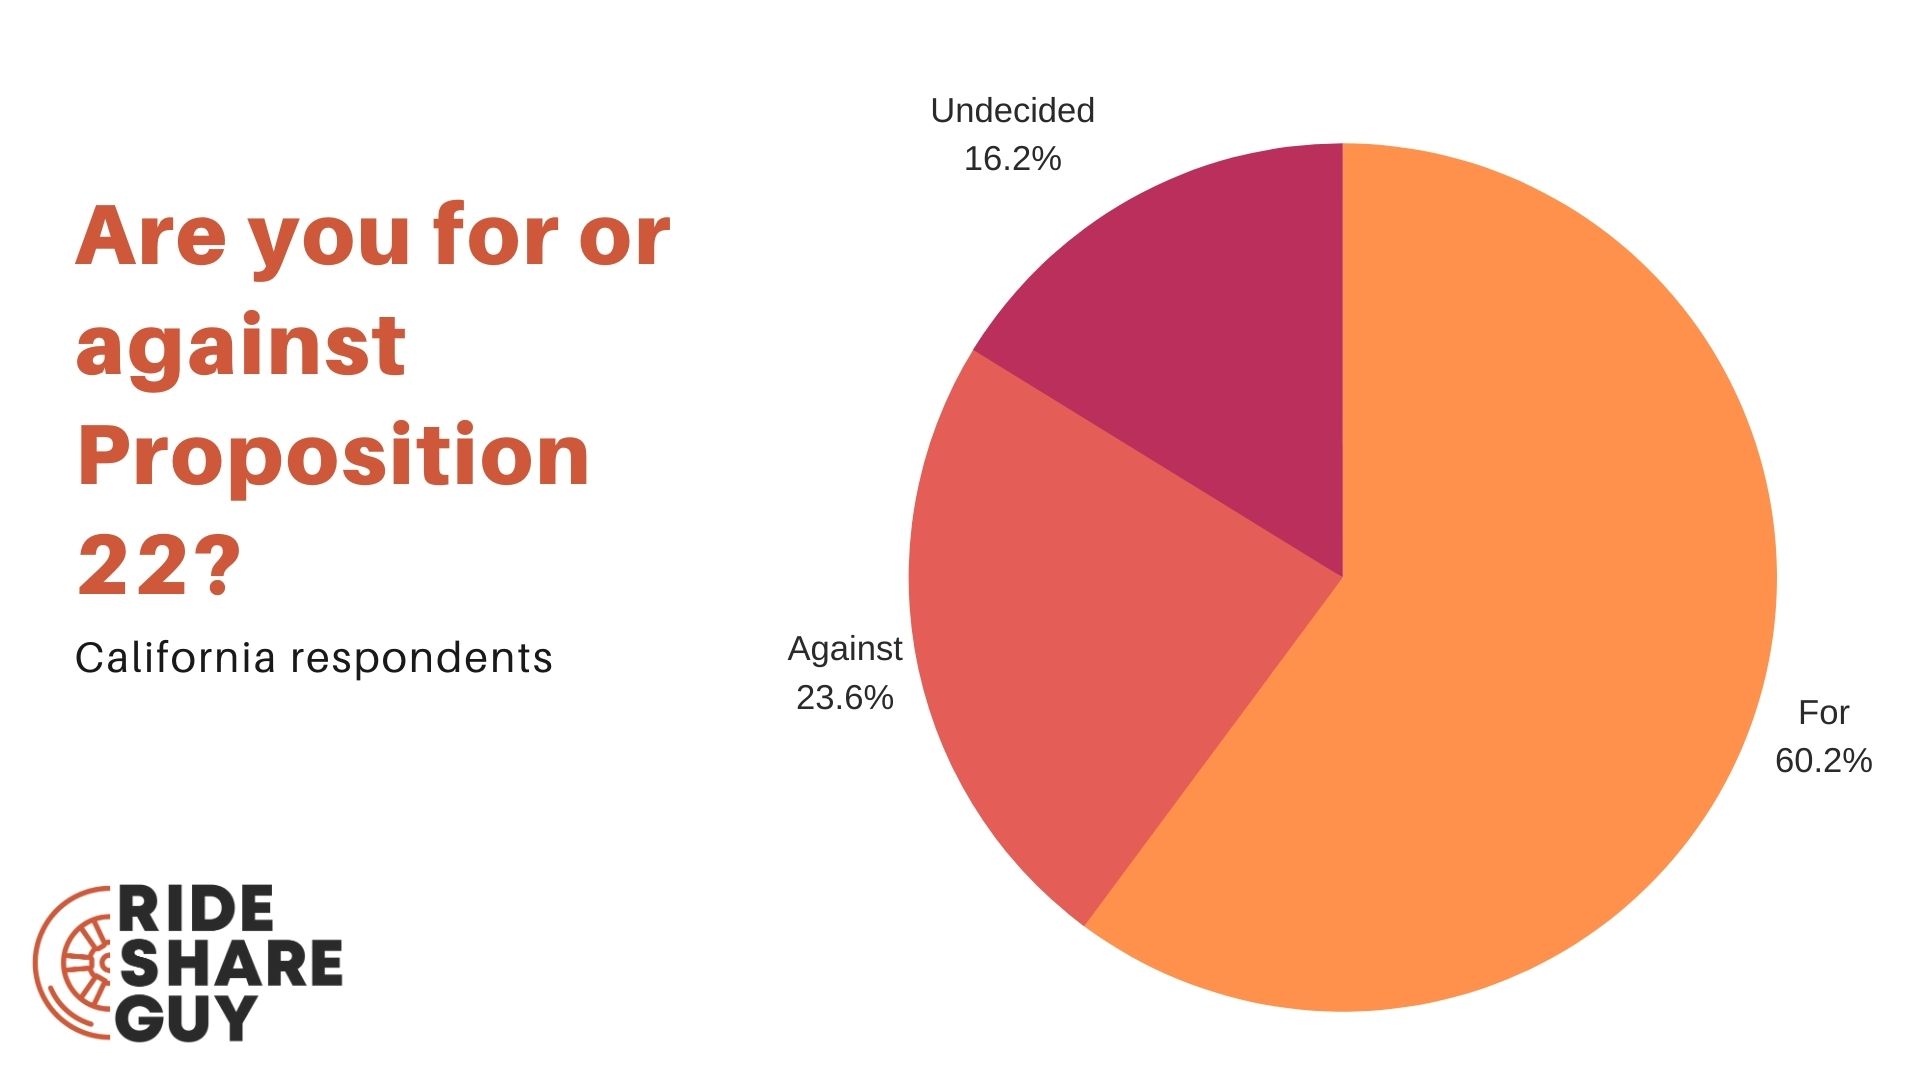
At the end of September, we sent a survey to our driver readers about Prop 22 and received 609 responses. Out of these respondents, 73.7% of drivers were from California. We asked a series of questions about Proposition 22, including:
- Are you for or against Proposition 22?
- Do you prefer to be an employee or an independent contractor?
- Why are you ‘for’, ‘against’ or ‘undecided’ about Prop 22?
Out of California respondents, 60.1% are in favor of Proposition 22, with 23.6% against and 16.2% ‘undecided’ or ‘I don’t know’.
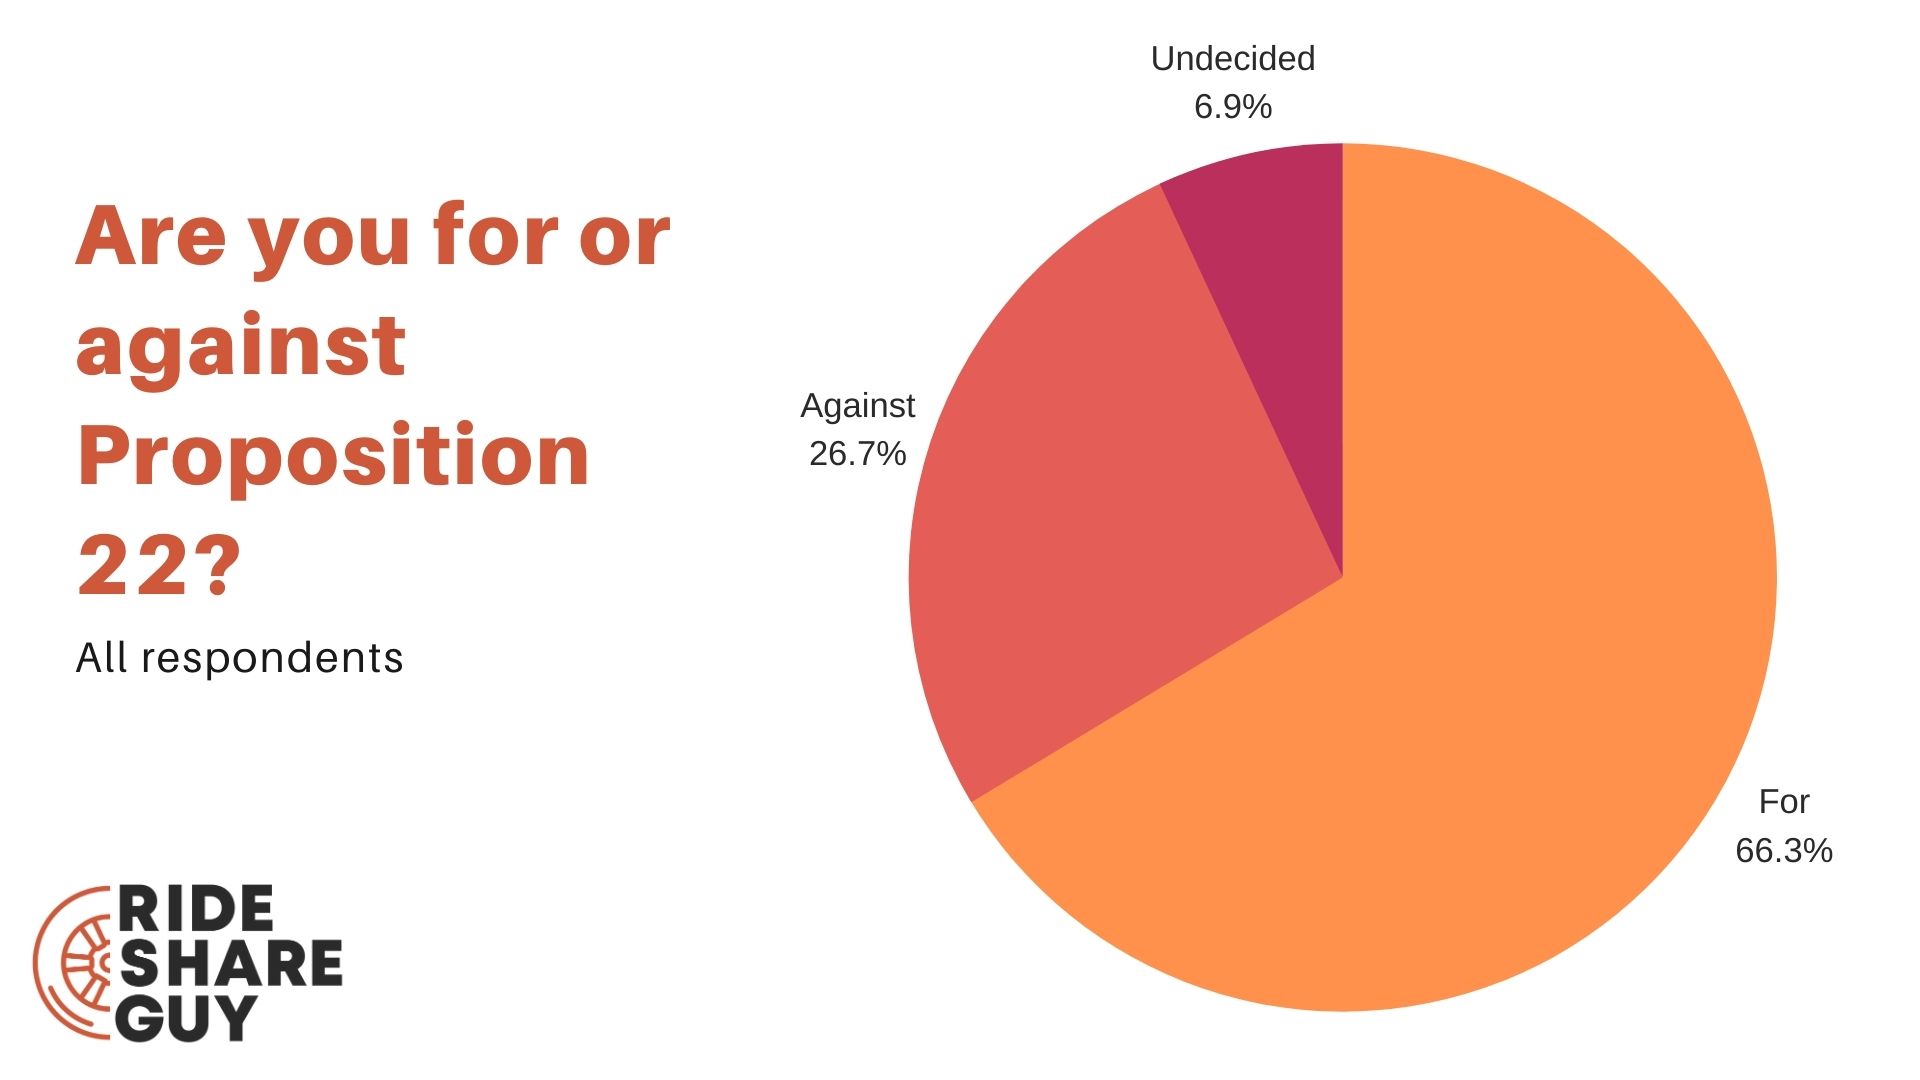
For all of our respondents, an overwhelming 67% are for Prop 22, while 27% are against and 7% are undecided.
Overall, the numbers between drivers nationwide and California-specific respondents did not differ too much – except for the number of undecideds.
If the ‘Against’ campaign was able to convince all Undecided respondents to vote against Prop 22, that would increase the percent ‘Against’ Prop 22 to 39.8% – not a victory, but much closer than 23.6%.
79% of Drivers Want to Remain Independent Contractors
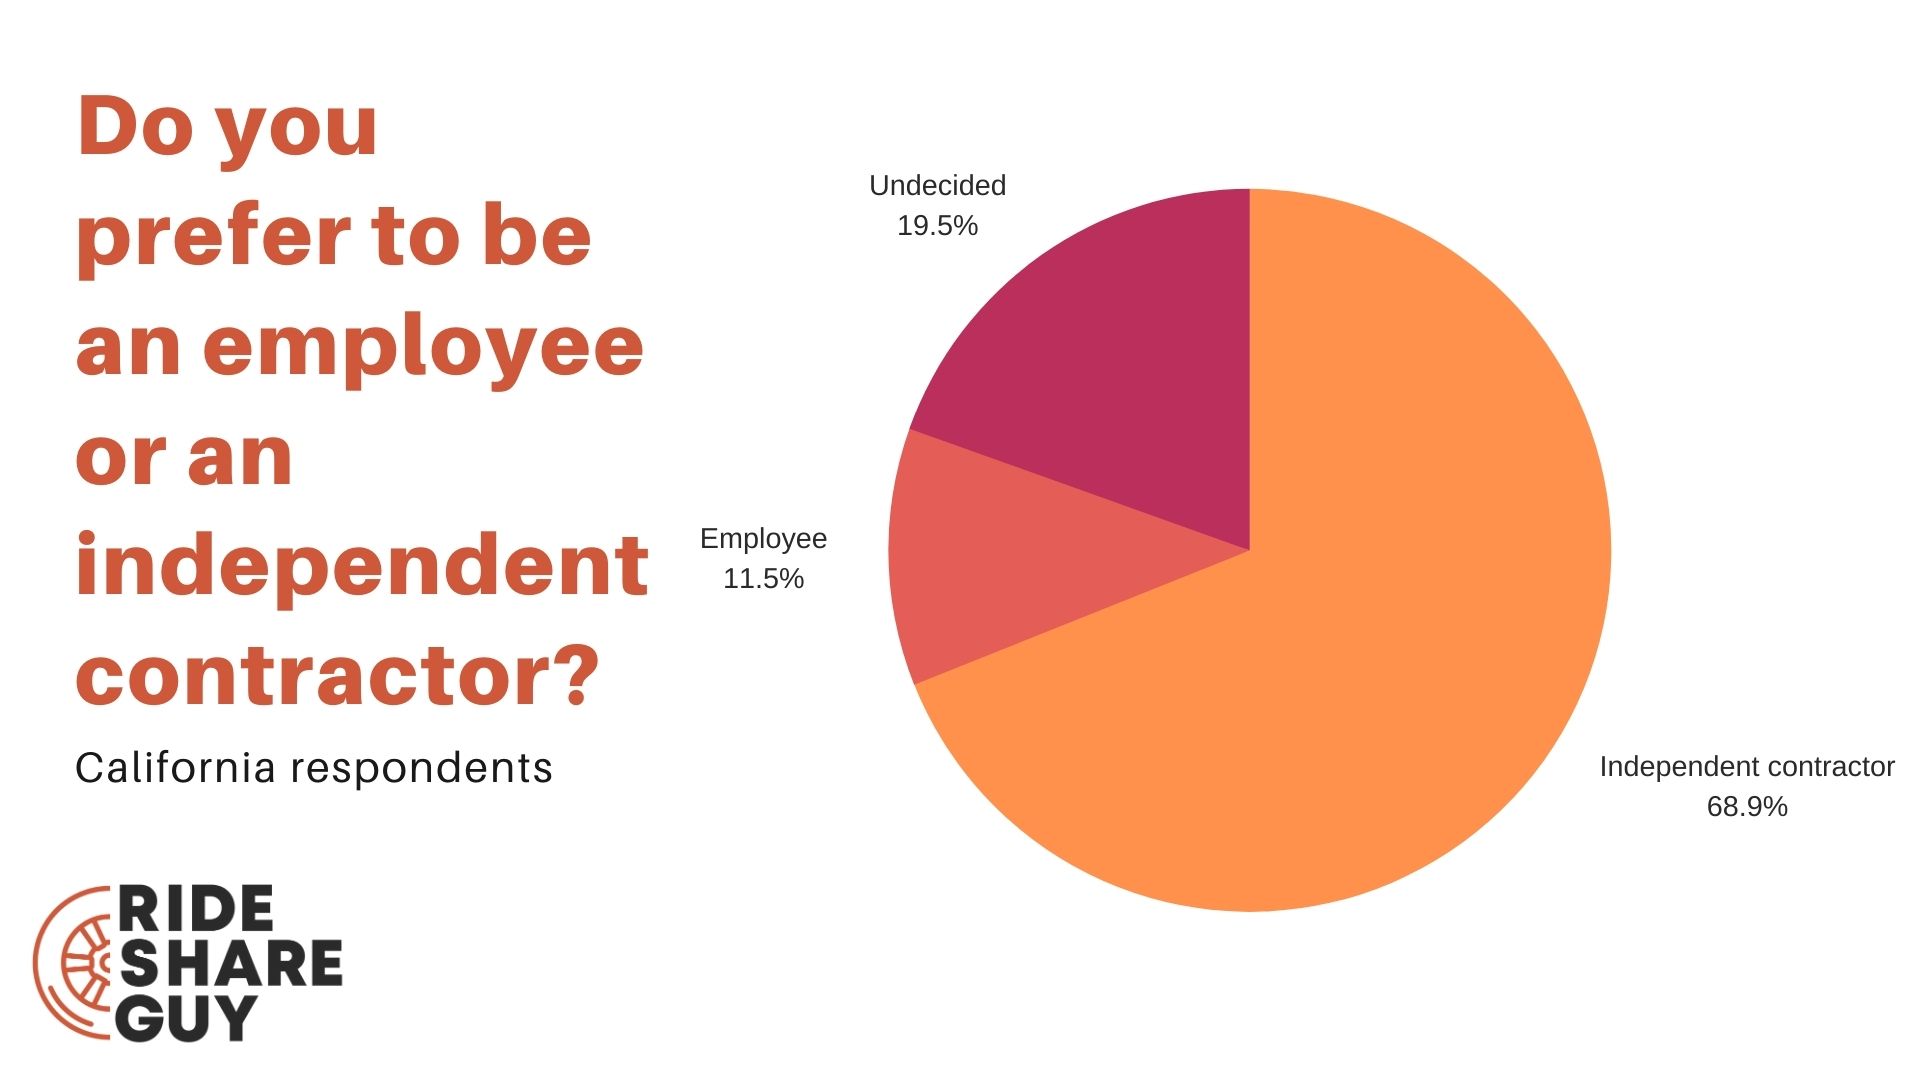
According to our results, out of California respondents, 68.8% said they wanted to remain independent contractors. Only 11.5% wanted to become employees, and 19.5% are undecided or said they didn’t know which classification they preferred.
This lines up fairly closely with the overall, nationwide responses we received. According to our poll results, nationwide 79% of respondents want to remain independent contractors, with 13% expressing the desire to become employees and 8% responding they weren’t sure/didn’t know.
This is similar to numbers we saw earlier this year when we polled our driver pool (see below).
Nearly 13% of polled respondents said ‘flexibility’ was their number one reason for wanting to remain independent, by far the highest percentage of all the reasons provided. Other reasons for wishing to remain an IC included:
- Control / autonomy
- Independence / freedom
- Not wanting to be ‘micromanaged’ or otherwise treated like an employee with specific shifts, hours to work, etc.
71% of Uber and Lyft Drivers Still Want to be Independent Contractors
We recently (5/6/20-5/11/20) sent out a survey to our e-mail list of 80,000 drivers across the country and posted on social media asking for responses to a simple 9 question survey and received 734 responses. The goal of the survey was to determine how Uber and Lyft drivers felt about employee vs independent contractor status in the wake of the coronavirus pandemic – have drivers’ attitudes toward becoming employees vs. independent contractors changed?
It turns out that 71% of drivers surveyed still want to be independent contractors. Prior COVID-19, 81% of drivers stated they wanted to remain independent contractors.
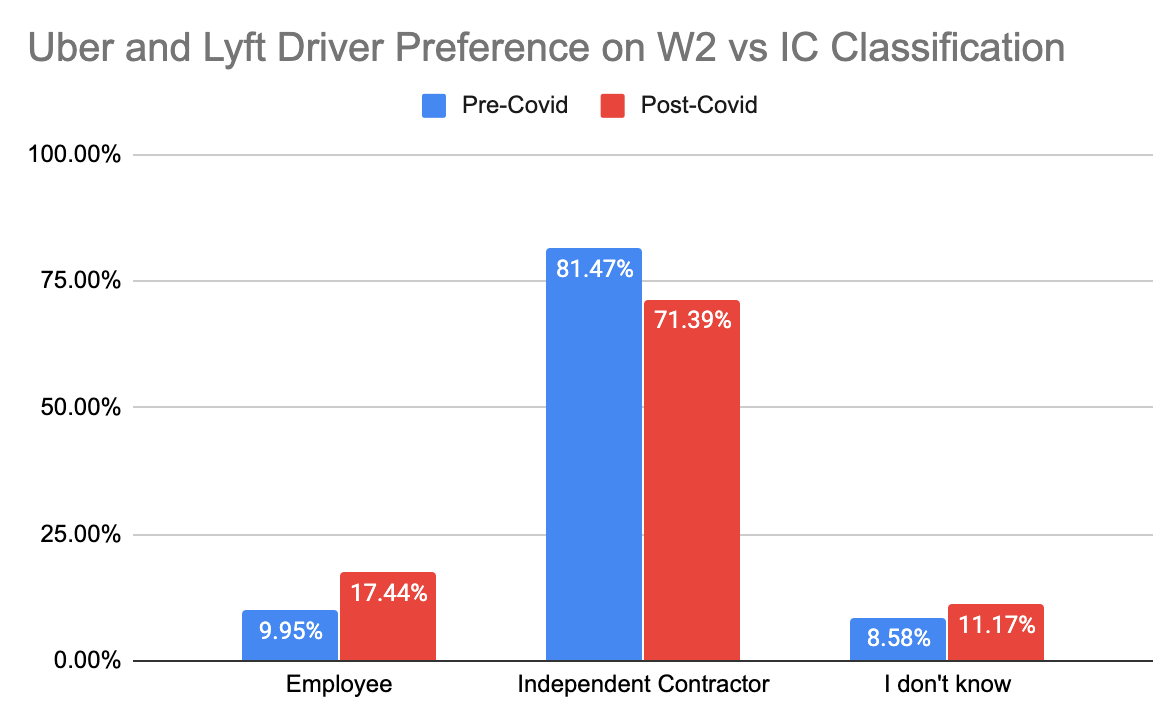
Although a minority of drivers, just 17%, would like to be designated as employees, this is a 75% jump from the 10% figure prior to Covid-19.
Uber Driver Pay Went Up By 17%
This was the most surprising finding of my survey since many drivers feel like they’re actually getting paid less these days, but the numbers tell a different story. Even though Uber made several rate cuts and did lots of ‘rebalancing’ over the past year, drivers reported current earnings of $19.73 per hour BEFORE expenses.
I don’t have a great explanation for why this number went up from 2018 to 2019, but we’ve actually seen drivers report increasing earnings over the past 3 years despite a number of rate cuts.
Here are a couple thoughts why earnings may have gone up:
- Weekly Bonuses: Even though rates have gone down over the past few years, I think weekly bonuses like Uber Quest have a huge impact on driver earnings – especially in the major cities. This allows Uber and Lyft to pay slightly more but also exert much more control over drivers.
- Running Out of Drivers: Uber and Lyft lyfthave a terrible retention rate, with 68% of drivers quitting after just 6 months. That means that millions of drivers have now churned through the platform and in a “good economy,” meaning Uber and Lyft are having to pay drivers more in order to keep them around. Fewer drivers means more surge, more bonuses, etc.
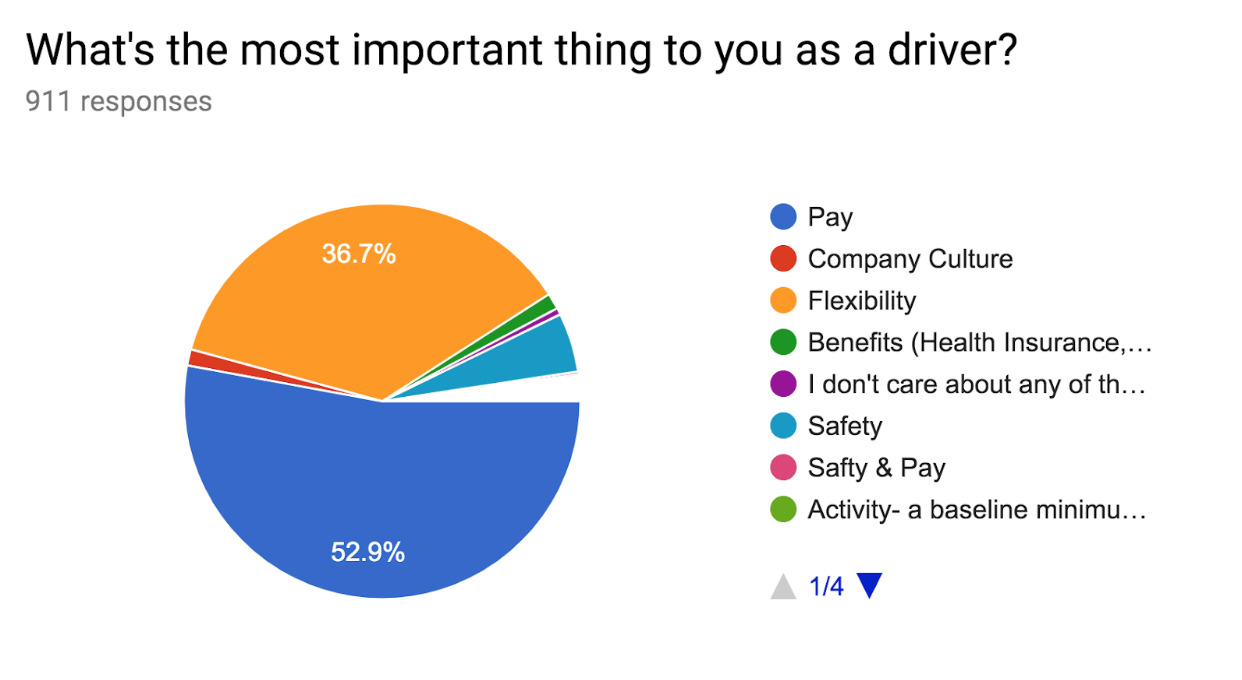
What would really scare me though if I were Uber is that driver pay may be increasing yet the perception is that drivers are being paid less than ever and satisfaction is getting worse. Pay is still by far the most important thing to drivers:
Gross earnings are just one part of the equation though and this year, we also asked drivers what they were earning after expenses. And after expenses, Uber drivers reported earning $13.47 per hour, which means that on average, drivers report that their car is costing them over $6 per hour to operate. No wonder our how to make 100 dollars fast article is so popular. That’s A LOT of money and as we’ve shown, a quality used Prius will only cost 20-30 cents per mile to operate, so it’s more important than ever to drive an efficient vehicle.
One of the reasons why I recommend flexible vehicle rental options to full-time drivers these days is because you know exactly what your costs are up front. If you drive 50 hours and pay $200 for a weekly rental and spend $100 on gas, that means your car is costing you exactly $6 per hour ($300/50). So you can see how renting a car makes a lot of sense for certain full-time drivers.
Uber Driver Earnings vs Lyft Driver Earnings
In 2019, Lyft drivers reported earning $17.49 per hour before expenses, which was $2.24 per hour less than Uber drivers. Drivers who reported equal driving for both Uber and Lyft were at $18.15 per hour, which tells me that only driving for Lyft may not be such a good idea anymore.
Here are some other head-to-head stats for 2019:
Uber Driver Satisfaction Takes a Big Hit
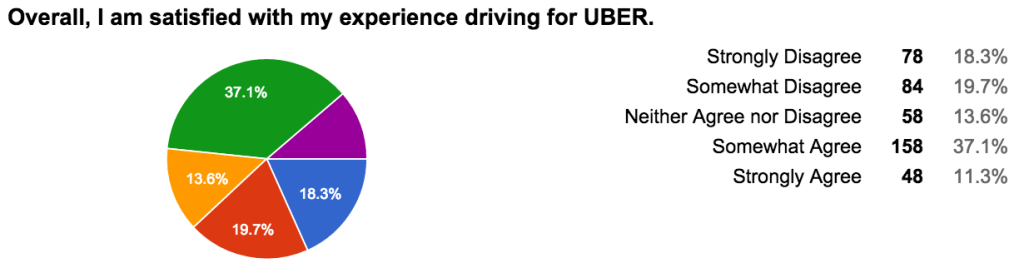
In 2019, just 47.8% of drivers said they were satisfied with their experience driving for Uber, a 10.4% drop compared to 2018. What’s most worrying about this drop is that Uber had a lot of momentum with drivers in 2018. If you recall, this is when they launched their ‘180 Days of Change’ campaign, brought in a new CEO and seemed headed in the right direction. But in 2019, they took a big step back and it seems like drivers are no longer a big focus at the company.
Even though the numbers show that drivers are earning more (the thing drivers care most about), driver satisfaction actually went down. When you couple this with the driver strikes we saw in 2019 and the organizing efforts around AB5, drivers (or lack of drivers) could be a big risk for the company in 2020.
For this reason, it’s not surprising that we saw many drivers leave rideshare driving during 2020 for some of the best food delivery services to work for. In addition to the pandemic, which already put a dent in rideshare demand and supply, drivers began to realize they could make the same if not more with delivery options. Also, they didn’t have to deal with the occasional hassle of troublesome passengers.
Interestingly enough, in 2021, Uber expressed some concern that when demand does pick up for rideshare, there won’t be enough drivers to respond to the pings. We’ll see if this concern bears out as travel demand rebounds in 2021 as expected.
Uber and Lyft Drivers Want to Be Independent Contractors
Even though AB5 in California has gotten a TON of media attention, political support and retweets on Twitter, most drivers want to be independent contractors. In our 2019 survey, 66% of drivers said they wanted to be independent contractors vs 15.8% who wanted to be an employee.
This number lines up with my anecdotal conversations and also makes a lot of sense when you think about the fact that most drivers are doing this part-time, so they often value the flexibility more than the pay.
Turning drivers into employees could adversely impact older drivers — 43% of drivers we surveyed are older than 61 and a full 10% are over 71 years old. If Uber and Lyft drivers are required to drive certain shifts, it could hurt older drivers who need flexibility. Older drivers often are supplementing their retirement nest egg and some can only drive when they feel comfortable such as during daylight hours.
83.5% of drivers we surveyed work for more than one service. In other industries, employees are sometimes forbidden to concurrently work for a competitor. Imagine if Uber enacted such a rule to its drivers who are now classified as employees. It could damage Lyft’s ability (or other gig companies) to attract drivers while simultaneously limiting income opportunities for gig-workers. It could also make it difficult for new companies to enter the market and compete.
You can see in the chart below that Uber has 50.8% market share amongst all gig companies and 23% of drivers do both Uber and Lyft. So if those dual app drivers had to choose one or the other, Uber’s total market share could go as high as 73.8% in this scenario.
How Can Cities Help Uber and Lyft Drivers?
Even though there’s a lot of debate on the independent contractor vs employee issue right now, there are certain things that all drivers care about and that cities and states should look to address right now. For the first time (with the help of our friend Warren Logan, formerly of the SFMTA), this year, we asked drivers what cities could do to help Uber and Lyft drivers and the top responses were:
- 55% of drivers said enact higher pay/rates
- 36% said a cap on the number of rideshare drivers
- 33% said more bathrooms!
What’s interesting to me is that most drivers want higher pay but the mechanism that achieves it really matters. If it’s higher pay via employee status, that won’t work for a majority of drivers. But if it’s higher pay through minimum wage guarantees like we’ve seen in New York City, that’s a different story. And while it may take a lot more political will to pass minimum pay legislation (but not as much as it used to take), more bathrooms is something that cities definitely have the power to help with today.
Uber and Lyft Need to Do a Lot More for Driver Safety
Most stories in the media about rideshare safety revolve around drivers behaving badly but as any driver will tell you, rideshare driving can be a lot scarier than being a rideshare passenger. Try picking up a passenger in a dark alley at 2 am on a Saturday night, when all the app tells you is a fake first name and there’s no picture of the passenger.
In this area, Uber and Lyft were equally bad, with 53% of Uber drivers saying that the company needs to do more for driver safety and 54% of Lyft drivers saying the same thing. So it’s no wonder that 22% of drivers reported carrying some type of weapon while driving.
Only 18.8% of drivers are female. Lack of sufficient safety measures could be a contributing factor. As a rideshare driver you are picking up a stranger to go to an unknown destination for an undetermined amount of time/miles. But the driver is only given this information after the passenger is in the vehicle.
There is no camera to record the passenger (unless the driver installs one at their own expense) and no safety glass between the passenger’s seat and driver’s seat like you will find in New York City Taxi cabs.
As a driver you are also not encouraged to cancel rides for your own safety or for any reason. It will hurt your driver rating. For instance, a female driver can not filter for only female passengers or filter out young males. On the other hand, filters could lead to discrimination against certain passenger demographics.
Three Interesting Stats
Feel free to read our full report on this year’s survey results, but three other questions I wanted to highlight can be found below:
Political Affiliation
With election season looming, Uber and Lyft drivers could become an interesting discussion in the political landscape with the W2 vs employee debate and more. I was surprised to see that drivers are pretty split among political affiliations though.
Rideshare Insurance
Despite there being numerous rideshare insurance options, nearly 40% of drivers still don’t have rideshare insurance. A big reason for this in my mind is because most drivers don’t know it’s required or the cost is prohibitive. Uber and Lyft allow drivers to sign up to be a driver with personal insurance but you really need rideshare insurance in order to make sure you’re protected. This shifting of risk and liability can hurt drivers big time if or when they get into an accident during Period 0 or 1.
Autonomous Vehicles (1=not worried at all, 5=extremely worried)
A majority of drivers are not worried about autonomous vehicles at all despite they hype in the media and fervor in the investment community. Drivers may not be experts in self-driving technology but they do know about all the on the ground and manual work it takes at times to find a passenger, put up with their shenanigans and of course clean up their puke. Automation may be able to solve all of these problems but it will definitely take some time and no one is thinking about it in this context.
We asked 81 questions in total in our 2019 Lyft and Uber Driver Survey so if you’re a member of the media and would like to review the full list for a potential story, please reach out to me
There you have it, the 2019 Lyft and Uber driver survey results. What stood out to you and what do you think about the increase in driver pay but decrease in driver satisfaction?
Congratulations to our winners of the following prizes!
Grand Prize: One 30 minute consultation with Harry ‘The Rideshare Guy’ – Kbickel
First Prize: 5 lifetime memberships to our video training course: Maximum Ridesharing Profits – Everydam, Jac, BMS, Mrj, Mo09
Second Prize: 5 $20 Amazon e-gift cards – Ascend, David, Flow, CT, Peg2
Third Prize: 10 Rideshare Guy Trucker Hats – SPP, ALPhil, Walt, RandyTW, Sirron, JimS, DFlest, DMyers, TrishaM, AnnM
Fourth Prize: 10 copies of The Rideshare Guide: Everything You Need to Know About Driving for Uber, Lyft, and Other Ridesharing Companies – AKRem, Lola, Solomon, JDTub, IMaccart, MariaH, ThePer, Gams, GTwen, Pmstern
-Harry @ RSG
Uber Surveys Drivers in 2020
Rideshare drivers have been complaining about Uber for years. Is it possible that Uber is finally listening? Basically, that’s a big “we’ll see” at the moment, but Uber looks like they are trying to make a start at improving in ways that drivers want.
Uber created a 2020 Uber Experience Survey they sent out to “every driver and delivery person in the US who took a trip or made a delivery with Uber between January 1 and September 22, 2020” for feedback.
The survey itself was open to taking from October 1–October 16, 2020. They received 98,410 individual responses, and the results were collected by Uber and Qualtrics, a data and research company.
It appears the survey was sent primarily in response to gauging drivers’ feelings about the platform’s handling of the pandemic, but did encompass general questions that could help Uber make improvements if they decide to move forward on anything based on the results.
But, as James in Denver, CO said, “Not sure it matters. The feedback I have offered before seemed to fall on deaf ears.”
Uber Survey Results
The results aren’t all that surprising, but now they are in the hands of Uber to go and make a difference and prove to their drivers they want to make positive changes to give drivers a better overall experience.
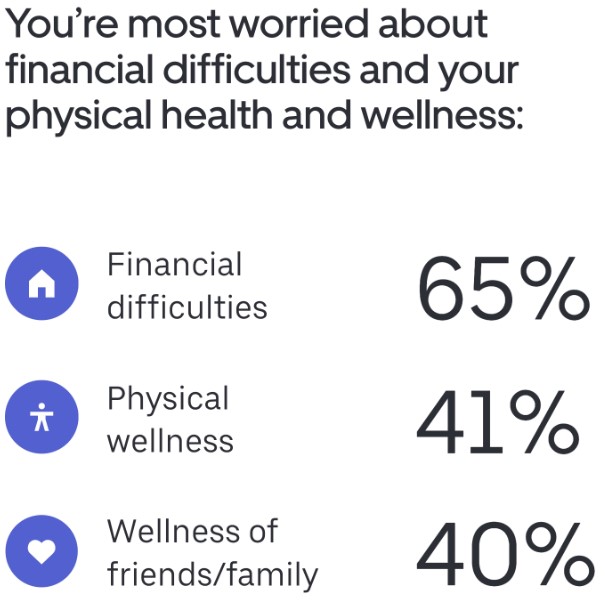
During a pandemic, it seems fitting that drivers’ main concerns are financial difficulties, physical wellness and the wellness of friends/family.
Overall, it did surprise me that 80% of those surveyed said they are either very satisfied or somewhat satisfied with their experience driving for Uber.
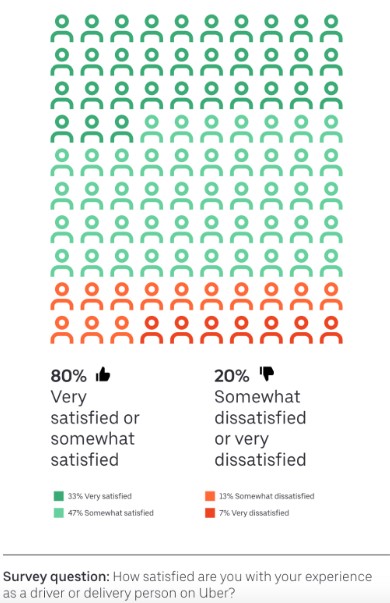
Granted, working in the field I do, I tend to hear more of the horrible experiences than the great experiences on a daily basis.
But, with 47% at “somewhat satisfied” for their answers, it shows there is definitely room for improvement. If I am saying I’m “somewhat satisfied” about something, it usually means “well, it’s not awful, but I’m not really happy with it”. You know, that midwestern passive-aggressive attitude that we call “Minnesota nice” so we don’t insult anyone by telling them we’re unhappy. It’s like if a friend asks if you like their outfit and you say it’s “interesting” instead of “hideous”.
As expected, the part of the job drivers are most satisfied with is the flexibility and being able to drive whenever they want. Historically, this has been an important part of the job for the majority of drivers and one reason many California drivers considered AB5 to be…less than ideal since it wouldn’t require Uber and Lyft to maintain the flexibility they had previously extended to their drivers.
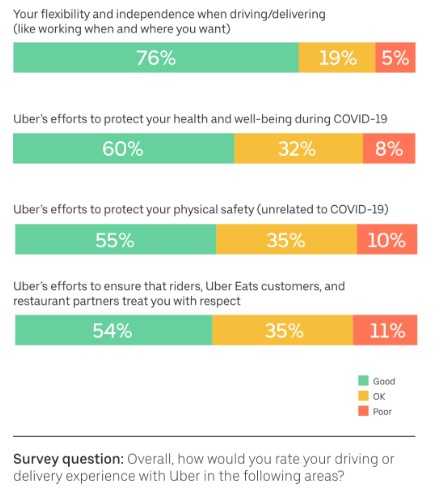
After flexibility, in relation to the Covid-19 pandemic, drivers considered Uber’s efforts to protect their health and well-being to be “Good,” with 60% ranking Uber at that level.
After all, Uber did make personal protective equipment available to many drivers, free of cost, throughout the pandemic. They also have made statements and some efforts to ensure drivers and passengers alike are to wear masks throughout all rides.
As part of the survey, Uber even points out what drivers are not satisfied with, showing at least an acknowledgment of mistakes.
Both the dependability of earnings and the quality of customer support are things that Uber realizes they need to improve on.
Drivers want to know what to expect each week when it comes to earnings. It’s hard to build budgets and stick to them if your income can vary by several hundred dollars one week into the next.
Not surprisingly, rates and fees made the cut for where drivers think improvements could be made. Over the past several years, we’ve seen rate decrease after rate decrease, having to work longer hours and more days just to make up for those changes.
Another unreliable aspect is the promotions and incentives that Uber gives out. One week could show grand incentives and promotions that can earn you an extra hundred or more while the next week there’s nothing extra being offered.
It’s a well-known fact among drivers that Uber customer support is awful. You find yourself in a situation out of your control and you need the help of customer support, so you go into your app, but that’s the first step that shows something is wrong. It’s difficult to find where you can actually connect with support directly.
Then, once you miraculously find out how to contact support, you get canned responses that don’t answer your question, runaround answers from 10 different people saying the same thing, and promises that it will be resolved within a certain time frame and that you’ll be contacted again, only to hear nothing back and for the issue to persist.
Kramer from Portland, OR said of customer support, “Their ‘empathy’ is robotic and doesn’t add to the experience at all. We need people in those roles who know what’s going on and can give real answers.”
So, even though Uber has an 80% approval rating among drivers, according to this survey, they still have a long way to go to make everyone satisfied.
What Could Uber Do to Make Things Better for Drivers?
I truly hope that Uber will take this information and make some use out of it. I don’t think any of us expect a raise in driver pay—I’m pretty sure I’ll die of shock the day that happens—but perhaps they will make improvements to customer support or even be more consistent with their promotions and incentives.
Uber could do two major things right now to make a majority of drivers happy:
- Increase driver pay – yes, this could be hard because Uber ‘isn’t profitable’ yet. But they could take steps to make pay more reliable on a weekly basis. Don’t provide, then yank, driver bonuses every week. Make them monthly, and make them consistent.
- Hire customer service reps that are actually familiar with Uber – Again, this is probably more expensive than whatever company Uber has contracted out with for CSRs. However, customer service is notoriously bad and has been bad for years. How amazing would it be to call or contact Uber and actually get someone who a) knew what you were talking about and b) had some leeway to fix the situation? Less back and forth, less demanding to speak to managers, less time wasted for everyone. Surely that would be cheaper for Uber?
What drivers are looking for isn’t really radical. Many drivers are, at this point, aware that pay can be low (depending on when and where you drive). What drivers want is something they can rely on consistently. We hear constantly from drivers who can’t pay for the car rentals weekly because one week’s earnings varies so wildly from the next – without any major changes to when/where they drive.
If Uber can’t raise pay, they could provide a better customer service experience. Listen to drivers when they call or contact you. If you can help them in that instance, do it. Cut down on the back and forth.
Perhaps this survey paired with the fact Uber recently hired a critic of theirs could mean they are truly looking to change for the betterment of drivers.
They honestly don’t need to do much to show they are listening, but they do need to do something. We’ll see!
Previous Years Surveys
Below you’ll find all of our previous surveys. Compare the data to see how the trends have been evolving over the years. If you’re a data scientist, you can contact Harry for raw data.
[tabby title=”2019″]
Expand the tabs above to see prior years and their results.
[tabby title=”2018 Driver Survey”]
2018 Driver Survey Results
The 2018 survey was sent out on 1/25/18 and we collected nearly 1,200 responses from drivers on our email list and through social media. If you’d like to review our full PDF report of the data, please click here. If you’re a media member or researcher and would like to see a full list of questions and/or calculations, please contact me. If you’re an advertiser or consulting client, and would like to discuss these results further or run a custom survey, please reach out to me.
Uber had a tumultuous 2017, but if you weren’t following the news cycle, you may not have even noticed since all that bad press did not have a negative impact on the actual day to day operations. Uber ended the year doing more rides than ever and drivers were actually more satisfied at the end of 2017 than they were compared to the year prior.
Lyft still had higher overall satisfaction and pay among their drivers compared to Uber, but the gap is narrowing. A majority of Uber drivers were satisfied with Uber’s 180 Days of Change campaign, which included new features like a tipping option and a 24/7 phone support line for drivers. Lyft made some small improvements to the driving experience in 2017, but they did not have a substantial driver-focused campaign like Uber did.
Pay and flexibility were still at the top of the list when it comes to why workers are flocking to rideshare driving, but drivers feel strongly that they are underpaid. In fact, they reported that they would like to make around 51.6% more than what they currently are earning, in addition to the Uber driver sign up bonus and Lyft driver sign up bonus.
Among topical issues in the news, drivers feel strongly that they should remain independent contractors and a majority are also for more stringent fingerprint based background checks as part of Lyft driver requirements and Uber driver requirements – Uber and Lyft are staunchly opposed to fingerprint based background checks.
How Did Uber’s Terrible Year of PR Affect Drivers?
Uber’s 2017 was full of scandals at the corporate level, but the effect on driver morale and more importantly driver earnings, was limited. At the beginning of 2017, 49.4% of Uber drivers reported that they were satisfied with their Uber driving experience and one year later, 58.2% of Uber drivers reported that they were satisfied with their Uber driving experience – a 9% increase in driver satisfaction.

2017 was the first year that Uber did not lower rates as part of their ‘Winter Warm-Up Promotion’ where Uber tries to increase a seasonal dip in demand by cutting rates. This practice had become an extreme annual frustration for drivers.
Another potential cause for the increase in driver satisfaction may have been due to Uber’s 180 Days of Change campaign which aimed to fix and improve the driver experience. Uber released driver-friendly features like tipping and a 24/7 support line, and it would appear that these new additions definitely helped the company’s standing with drivers.
In fact, 57.2% of drivers indicated that they were satisfied with Uber’s 180 Days of Change Campaign:

Uber Driver Earnings
Uber drivers also reported earning $16.90 per hour, which is nearly a dollar per hour more than last year. In mid 2017, Uber added a tipping option and continued to offer lucrative weekly bonuses in many cities.

We also found a positive correlation between number of trips given and increased reported earnings. New drivers (fewer than 500 rides) reported earning just $14.74 per hour before expenses compared to experienced drivers (10,000+ trips) who reported earning $20 per hour before expenses like rideshare insurance.

What Services Are Drivers Working For?
Uber dominates the conversation when it comes to the main service drivers are working for:

(Here’s how to become an Uber driver.) But even though Uber is the dominant player among drivers, that doesn’t mean there’s a whole lot of driver loyalty. Nearly 80% of drivers have actually signed up for 2 or more services with Lyft, Postmates, the DoorDash driver sign up bonus, UberEats and Amazon Flex, all siphoning drivers away from Uber.


Acquisition costs for drivers have been reported to be at an all-time high and competition between services is fierce. Since last year, Uber’s market share among drivers dropped nearly 1% while Lyft’s market share increased from 62.5% to 75.1%.
UberEATS was a standout on the delivery side and since last year, their market share went up from 14.8% to 22.5%. One reason why may be due to the fact that existing Uber drivers can essentially opt in to deliver for UberEATS without having to apply for a whole new service like with other delivery companies.
Drivers Still Prefer Lyft Over Uber
Although only 17% of drivers indicated that they primarily drive for Lyft, satisfaction among those drivers beat out Uber by a long shot. 75.6% of Lyft drivers reported that they were satisfied with their driving experience compared to just 58.2% for Uber.

Lyft drivers also reported earning $17.37 per hour, which was 47 cents per hour higher than what Uber drivers reported. In 2017, this gap was $2 per hour so it appears that Uber drivers are gaining on Lyft drivers when it comes to earnings.
A good possible explanation would be the tipping option that Uber added in the middle of 2017, since both companies pay nearly identical base mileage and time rates across the country.
Here’s a look at some key self-reported metrics and how Uber vs Lyft drivers compare:
| Uber Drivers | Lyft Drivers | |
| Average Hourly Earnings Before Expenses | $16.90 per hour | $17.37 per hour |
| Average Rating | 4.89 | 4.87 |
| Average Lifetime Trips | 2,516 | 1,969 |
Are Rideshare Drivers Underpaid?
As we’ve seen in prior years, the two things drivers care most about when it comes to rideshare are the pay and flexibility that the job offers.

But there’s a big discrepancy between what drivers think they should be getting paid and their actual pay. Uber and Lyft drivers report earning a combined $16.93 per hour before expenses, but they told us they think they should be earning $25.67 per hour. That’s a difference of 31% or nearly $9 per hour.

What Drivers Dislike About the Rideshare Experience
A majority of drivers are satisfied with their overall rideshare driving experience, but there are some areas that need improvement. A big complaint we hear from drivers has to do with UberPOOL and this year’s feedback about the product was no surprise.
65% of drivers in UberPOOL markets indicated that they were dissatisfied with their UberPOOL experience.

And while many assume that drivers feel similarly about Lyft Line, the results were surprising:

45.5% of drivers were actually satisfied with their Lyft Line experience compared to just 22% with UberPOOL. Lyft and Uber typically pay drivers the exact same rates across the country, but one area where their rates are different is with shared rides. Lyft actually pays the same rates for Lyft Line as they do for Lyft classic while Uber typically pays ~10% less for UberPOOL rides than UberX.
Uber added a $1 additional pick-up fee to the second UberPOOL rider in 2017 but it doesn’t seem like it had much of an effect with drivers.
Uber and Lyft Vehicle Choices
It may not come as a big surprise, but the most popular carmaker for drivers was Toyota and the most popular model was the Prius. In fact, 5 of the top 6 carmakers for rideshare drivers were Asian brands with Ford the lone American stand out.

The average age of driver’s vehicles was 2012 which is a bit of a surprise considering that Uber allows vehicles as old as 2002 or newer in many cities.
A cost effective solution for drivers to save money is by using Upside, which is an app that helps drivers save on gas, food and shopping.
Rideshare Insurance for Drivers
A majority of these drivers have NOT purchased rideshare insurance despite the fact that nearly every state now has at least one or two companies offering the product:

Driver Employment and Worker Misclassification
The constant employee vs independent contractor debate won’t be going away any time soon, but an overwhelming majority of drivers do not want to be employees. As an independent contractor you can deduct expenses with the help of services like the Stride Tax App.

When comparing full-time vs part-time drivers, we see a slight preference toward employee status from full-time drivers but a majority still want to be independent contractors.

Driver/Rider Safety
Uber and Lyft are staunchly opposed to fingerprint background checks, but a majority of drivers are actually for them. This echoes the feedback we hear from drivers whenever there are driver-related incidents in the media. And there may be a self-serving component since higher barriers to entry means less competition for existing drivers.

[tabby title=”2017 Driver Survey”]
2017 Driver Survey Results
The 2017 survey was sent out on 1/2/17 and we received 1,150 total responses. If you’d like to review our full PDF report of the data, please click here. If you’re a media member or researcher and would like to see a full list of questions and/or calculations, please contact me.
Driver Satisfaction With Uber
There’s a lot of turnover in the rideshare industry, with half of all Uber drivers quitting after just one year, but for the ones that remain behind, more Uber drivers are satisfied than dissatisfied. Of the 863 drivers who indicated they primarily drive for Uber, 49.4% agreed with the statement that they are ‘satisfied with their Uber driving experience’, while just 36.2% disagreed with that statement.

But as most drivers already know, some parts about driving for Uber are not so satisfying! Uber launched UberPool in 2015, but the confusing pay structure and additional hassle of picking up and dropping off multiple riders has been a major pain point for drivers. Predictably, we found that 56.5% of drivers disagreed with the statement that ‘they are satisfied with their UberPool experience’.

What Matters Most to Drivers?
Many of our top articles have to do with money (eg. Uber driver sign up bonus, Uber driver pay, Lyft driver sign up bonus, DoorDash driver sign up bonus, how much can I make, how to earn more, etc.) so it’s no surprise that 53.5% of all drivers indicate pay is the most important thing to them. And while pay has gone down for drivers over the years, it’s still one of the more flexible jobs available as seen below.
Money is also a big theme when it comes to why drivers are signing up for these services in the first place, with 51.9% indicating that they signed up because they needed ‘extra money’.

How Much Do Uber Drivers Make?
I’ve always had a problem with the earnings figures that on-demand companies advertise to prospective drivers. Many drivers end up earning much less than advertised and one of the biggest complaints I hear is that they’re not making enough money. But just how much is ‘enough’ is obviously up to interpretation.
How much do Uber drivers make? We found that Uber drivers reported earning $15.68 per hour, but since drivers are also responsible for gas, maintenance and depreciation, and rideshare insurance that number is likely less. Although as an independent contractor you can deduct expenses like mileage on your vehicle with the Stride Tax App, which helps save and increase overall income.

Lyft Drivers are Happier, Higher Paid and Higher Rated
I’ve always felt that Lyft was the more driver-friendly company and, based off our survey results from drivers who indicated they primarily drive for Lyft, an astounding 75.8% of them were satisfied with their Lyft driving experience compared to just 49.4% on Uber.

We also asked that same group of drivers about their earnings, and they reported averaging around $17.50 per hour or almost $2/hour more than what was reported by Uber drivers. It should be noted that Lyft drivers can receive tips in the app, and Lyft rates tend to be higher across the board but, like with Uber, drivers are still responsible for their expenses.
Lyft drivers also reported an average rating of 4.88 while Uber was slightly lower at 4.84.
Who Do Drivers Work for?
Since Uber and Lyft drivers are independent contractors, they are technically allowed to work for other companies, and we found that 67% of drivers (+/- 3%) reported working for at least two services.
Here are the Uber driver requirements if you’re wondering how to become an Uber driver. And here are the Lyft driver requirements.

Note: There is a 3% error margins since 3% of drivers indicated zero on-demand services, but in order to answer this set of questions, they also indicated that they were a rideshare driver for at least >0 months.
Although a majority of the drivers on our e-mail list are doing multiple services, it should be noted that 75% of drivers indicated that they still primarily drive for Uber.

But Lyft was a close second to Uber when it came to which company drivers prefer to drive for.

Driver Demographics and Discrepancies
This year we also asked drivers specific questions around demographics and found that 19% of Uber drivers and 19.2% of Lyft drivers are females – and that’s higher than the national average of 12.7% for taxi drivers and chauffeurs and much higher than the 1% of New York cabbies who are women. We also took a look at earnings by gender and found that women reported earning $14.26/hour, while their male counterparts reported earning $16.61/hour. This discrepancy could be explained by time of day/night, which was not something we controlled for.
Despite passenger demographics that favor the young, driver demographics are skewed the other direction, with 54% of drivers indicating they are 51 or over and 77.5% of drivers indicating they are 41 or older.

Those in the 61+ range reported almost $3 per hour less than the 18-30 category, and there was a distinct negative correlation that we found between increased age and lower reported earnings, which could also be a function of what hours were worked.

Rideshare drivers reported as being predominantly white, making up 78.3% of total drivers, which is higher than the national (regular population) average of 62.6%. Other ethnicities like Hispanic/Latino reported just 7.1% compared to the national average of 17.2% and Black/African Americans reported 6.8% compared to the national average of 13.2%.

Our research did find some pay discrepancies among certain ethnicities, with Black/African-American drivers (Uber and Lyft) reporting that they earned $13.96 per hour compared to the average reported hourly earnings of $16.08 for all Uber and Lyft drivers.
Drivers are well educated, with 53.3% of drivers reporting they have achieved a bachelor’s degree or higher compared to the national average of 33%.

For potential drivers who don’t have their own vehicle or who don’t want to use their personal vehicle, we recommend this Fair App promo code. Here is our Fair app review. And for drivers that want to make more money, use the Freebird app.
If you’d like to read our full report on this topic, please click here. If you’re a media member or researcher and would like to see a full list of questions and/or calculations, please contact me.
[tabby title=”2016 Driver Survey”]
2016 Driver Survey Results
The 2016 survey was sent out on 12/30/15 to 10,234 e-mail subscribers, of which 453 people responded.

According to Uber’s own numbers, half of all drivers quit after just one year. I was surprised to see that only 17.4% of my audience has only been driving for 0-3 months, which tells me that although there are a lot of new drivers out there, they aren’t finding the online resources like my site, rideshare Facebook groups and forums.
This also speaks to the challenges of organizing drivers since there are so many new drivers who really only talk to Uber and don’t know how to get in contact with their fellow workers.
A little quick math: If Uber currently has 400,000 drivers and half are quitting after one year, that means they need to replace about 17,000 drivers each month (200,000 drivers/12 months). And if they’re growing at a monthly rate of 10.6% (they announced 162,000 drivers on 1/22/15 and 400,000 drivers on 11/3/15 – active drivers are defined in both cases by having taken at least four trips in a single month), that means they need to hire 42,000 new drivers each month.
So in order to replace the drivers that are quitting AND sustain growth, Uber needs to hire about about 59,000 drivers in total every single month. Wow!

If you’re wondering where Uber finds all of those new drivers, this chart gives a good glimpse into that. I’ve talked before about Uber’s main marketing channels and although I’ve always known they pumped a lot of money into their referral program, I was surprised to see that so many people ‘heard from a friend’ about driving for Uber.
Not all of these word of mouth referrals are paid referrals, but it’s impressive to see just how important the network effect is when recruiting on the supply side. Basically by having such a large passenger base, this also helps recruiting efforts. This is also why a lot of the smaller to mid tier ‘Uber for X’ companies have such a hard time recruiting new drivers (and they don’t have as much $$ obviously).
If you’re curious about some of the ‘other’ responses you can view those here. The only major category I missed was Facebook ads, which is basically the same type of paid marketing as Google Ads.
Who’s Driving For Uber And Why?


I’ve commented many times before that most drivers prefer driving for Lyft, but they get more rides and make more money with Uber. I think these two charts prove that pretty clearly. Even though an overwhelming majority of drivers are primarily working for Uber and thus making more money with Uber, an equal number of them prefer Lyft to Uber.
Lyft is often mentioned in the same breath as Uber, but outside of a few select cities like SF and Austin (where Lyft claims 40% and 45% market share respectively), they don’t offer much in the way of passenger demand. Drivers in small to mid tier Lyft markets often wait 30 minutes+ for rides and ETAs can be as high as 20-30 minutes.
But Lyft has done a great job cultivating a special relationship with drivers. I’m not saying they’re perfect (ahem $1,000 driver bonus snafu), but when their president e-mails drivers after fare cuts to explain why Lyft had to cut fares, that says something.
Lyft has always been on the forefront of driver friendly features, but there just hasn’t been enough demand to make it a viable main option for drivers. Imagine how many more drivers would prefer Lyft over Uber if they actually made the same amount of money as they did driving for Uber!
Who’s Doing Most Of The Work?

Uber has obviously been in the news a lot about its controversial tactic of treating drivers as independent contractors instead of employees. In response to the current lawsuit they’re facing in California, even Uber’s CEO Travis Kalanick has stated that Uber is best suited as a way “to fill in the gaps”, implying that employee status would not make sense for a bulk of their drivers.
Their recently released survey confirms that 50% of drivers are driving 10 hours a week or less on average. Uber is clearly presenting driving as a secondary gig and some (Harris & Kreuger) have even called for a third class of worker since your average Uber driver doesn’t fit into the traditional employee/independent contractor boxes. But the problem with these assessments is that they don’t take into account who’s actually doing a majority of the work.
Based off the numbers collected in our survey, we calculated that 50% of drivers are working 20 hours a week or less, but they only account for a total of 24% of the actual hours worked out on the road. This is similar to the phenomenon we see with Airbnb ‘super hosts’ that bring in a majority of income for Airbnb with hotel style listings as opposed to private rooms or individual listings.
If you take the mid-point of hours worked (i.e. 5 hours for 0-10) for drivers in our survey and multiply it by the number of drivers you get a rough approximation of each group’s contribution to the total hours worked.
| Hours Per Week | # Of Drivers | % Of Total Drivers |
% Of All Hours Worked |
| 0-10 | 85 | 19% | 4% |
| 11-20 | 139 | 31% | 20% |
| 21-30 | 107 | 24% | 26% |
| 31-40 | 57 | 13% | 19% |
| 40+ | 65 | 14% | 31% |
You can see pretty clearly that a majority of the work is not being done by the 0-10 or even 10-20 hours per week crowd.
This poses several questions:
- Which group of drivers (part-timers who make up a larger % of the workforce but do less of the work OR full-timers who make up a smaller % of the workforce but do most of the work) should be given more weight when it comes to policy discussion?
- Should a third class of worker be created for a group of workers (0-20 hours per week) that only make up 24% of all hours worked on the platform?
- If 30+hrs/week is considered full-time, that means half of Uber’s drivers could actually be more closely associated with employee designation than the independent contractor designation based off hours worked.
Another analysis performed on Uber’s data from January of 2015 came to a similar conclusion.
Why Do Drivers Drive?

Uber touts the flexibility of driving for Uber all the time and it’s actually one of the points that I’ve always agreed with them on. I don’t think most people realize just how flexible being a driver is. I can literally turn the app on right now and get a request within 10 minutes and be making money.
Satisfaction With Driving
When Uber announced in December that their drivers were happier than ever, I was pretty skeptical. It didn’t pass the smell test for two reasons.
- Drivers are now making less than ever because of fare cuts, so even if Uber replaced their entire workforce, how could drivers who now make less money be happier?
- Uber has actually gotten less flexible over the past year since they now institute policies like guaranteed hourly earnings which require drivers to work certain times and accept certain percentages of fares. If drivers care so much about flexibility, wouldn’t less flexibility mean less happiness?
Uber’s survey actually found that 81% of polled drivers said they were satisfied with the overall experience of driving for Uber — up from 78% the previous year. Uber polled an unknown number of drivers (and received 833 responses) from 24 of Uber’s largest markets including Los Angeles, San Francisco, Chicago and New York City.
My survey was sent to 10,234 drivers and of the 453 driver responses, only 48.4% of drivers somewhat agreed or strongly agreed (my top markets also included Los Angeles, San Francisco, Chicago and New York City). So I think my skepticism of Uber’s survey was valid. I’d be curious to know exactly how Uber picked it’s sample size for this survey and what questions they asked (both of which were withheld from me at least).
[tabbyending]